Immigrants from Iraq vs Jordanian Disability Age Under 5
COMPARE
Immigrants from Iraq
Jordanian
Disability Age Under 5
Disability Age Under 5 Comparison
Immigrants from Iraq
Jordanians
1.1%
DISABILITY AGE UNDER 5
96.5/ 100
METRIC RATING
97th/ 347
METRIC RANK
1.1%
DISABILITY AGE UNDER 5
98.5/ 100
METRIC RATING
74th/ 347
METRIC RANK
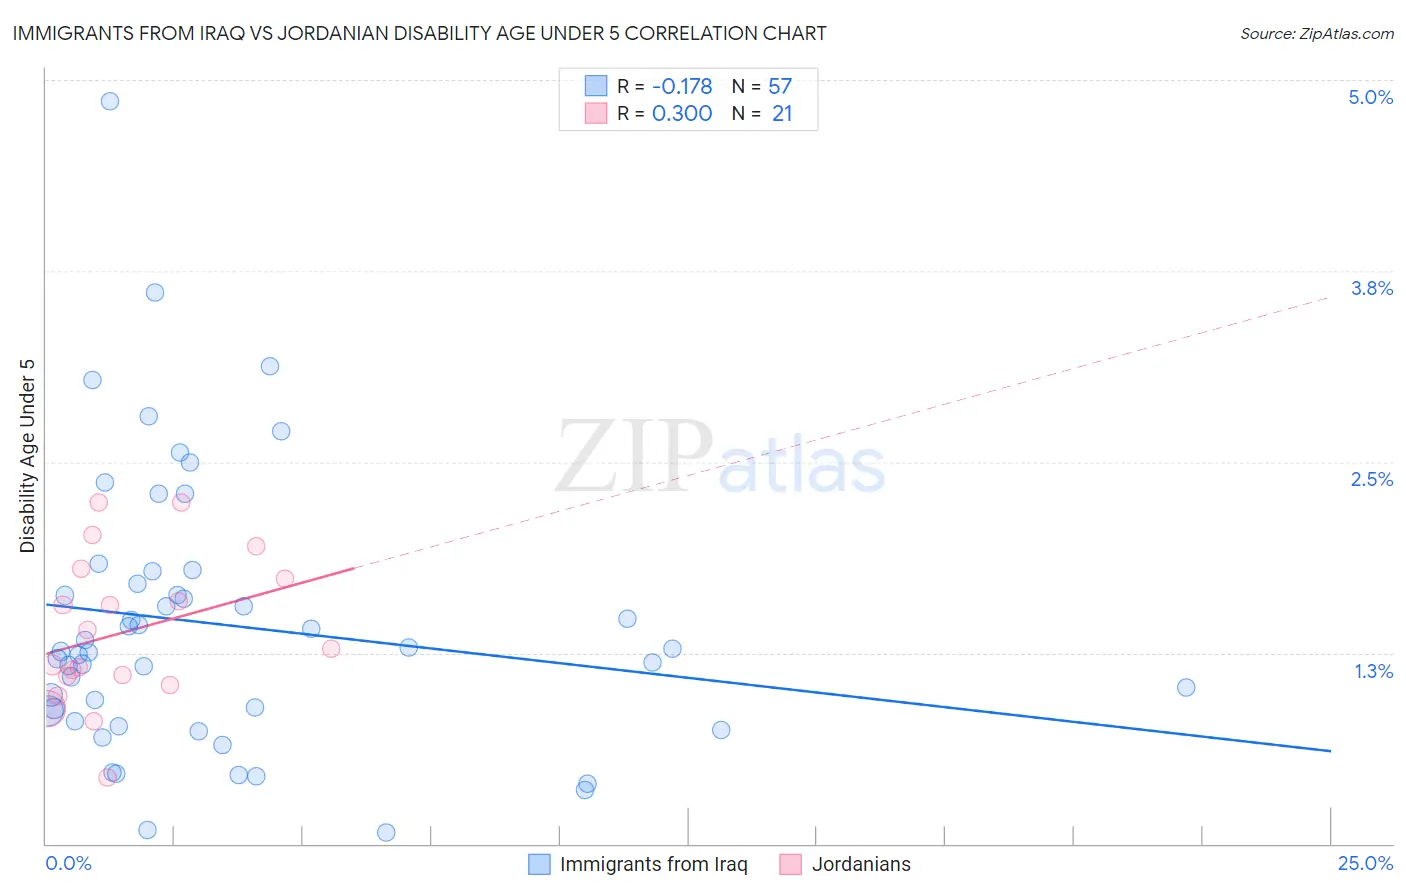
Immigrants from Iraq vs Jordanian Disability Age Under 5 Correlation Chart
The statistical analysis conducted on geographies consisting of 131,193,910 people shows a poor negative correlation between the proportion of Immigrants from Iraq and percentage of population with a disability under the age of 5 in the United States with a correlation coefficient (R) of -0.178 and weighted average of 1.1%. Similarly, the statistical analysis conducted on geographies consisting of 116,567,242 people shows a mild positive correlation between the proportion of Jordanians and percentage of population with a disability under the age of 5 in the United States with a correlation coefficient (R) of 0.300 and weighted average of 1.1%, a difference of 2.1%.
Disability Age Under 5 Correlation Summary
| Measurement | Immigrants from Iraq | Jordanian |
| Minimum | 0.070% | 0.43% |
| Maximum | 4.9% | 2.2% |
| Range | 4.8% | 1.8% |
| Mean | 1.4% | 1.4% |
| Median | 1.3% | 1.3% |
| Interquartile 25% (IQ1) | 0.84% | 1.1% |
| Interquartile 75% (IQ3) | 1.7% | 1.8% |
| Interquartile Range (IQR) | 0.91% | 0.70% |
| Standard Deviation (Sample) | 0.90% | 0.48% |
| Standard Deviation (Population) | 0.89% | 0.47% |
Similar Demographics by Disability Age Under 5
Demographics Similar to Immigrants from Iraq by Disability Age Under 5
In terms of disability age under 5, the demographic groups most similar to Immigrants from Iraq are Immigrants from South Eastern Asia (1.1%, a difference of 0.010%), Mongolian (1.1%, a difference of 0.10%), Dominican (1.1%, a difference of 0.14%), Nicaraguan (1.1%, a difference of 0.17%), and Immigrants from Moldova (1.1%, a difference of 0.20%).
| Demographics | Rating | Rank | Disability Age Under 5 |
| Chinese | 97.2 /100 | #90 | Exceptional 1.1% |
| Albanians | 97.2 /100 | #91 | Exceptional 1.1% |
| Immigrants | Cuba | 97.0 /100 | #92 | Exceptional 1.1% |
| Spanish Americans | 96.9 /100 | #93 | Exceptional 1.1% |
| Sri Lankans | 96.8 /100 | #94 | Exceptional 1.1% |
| Immigrants | Moldova | 96.8 /100 | #95 | Exceptional 1.1% |
| Mongolians | 96.6 /100 | #96 | Exceptional 1.1% |
| Immigrants | Iraq | 96.5 /100 | #97 | Exceptional 1.1% |
| Immigrants | South Eastern Asia | 96.5 /100 | #98 | Exceptional 1.1% |
| Dominicans | 96.3 /100 | #99 | Exceptional 1.1% |
| Nicaraguans | 96.3 /100 | #100 | Exceptional 1.1% |
| Immigrants | Uganda | 96.1 /100 | #101 | Exceptional 1.1% |
| Immigrants | Morocco | 96.0 /100 | #102 | Exceptional 1.2% |
| Immigrants | Nicaragua | 96.0 /100 | #103 | Exceptional 1.2% |
| Indonesians | 95.9 /100 | #104 | Exceptional 1.2% |
Demographics Similar to Jordanians by Disability Age Under 5
In terms of disability age under 5, the demographic groups most similar to Jordanians are Immigrants from Sri Lanka (1.1%, a difference of 0.0%), Burmese (1.1%, a difference of 0.090%), Immigrants from Pakistan (1.1%, a difference of 0.090%), Trinidadian and Tobagonian (1.1%, a difference of 0.25%), and Immigrants from Ecuador (1.1%, a difference of 0.31%).
| Demographics | Rating | Rank | Disability Age Under 5 |
| Immigrants | Belize | 98.7 /100 | #67 | Exceptional 1.1% |
| South Africans | 98.7 /100 | #68 | Exceptional 1.1% |
| Israelis | 98.7 /100 | #69 | Exceptional 1.1% |
| Immigrants | Ecuador | 98.6 /100 | #70 | Exceptional 1.1% |
| Trinidadians and Tobagonians | 98.6 /100 | #71 | Exceptional 1.1% |
| Burmese | 98.5 /100 | #72 | Exceptional 1.1% |
| Immigrants | Sri Lanka | 98.5 /100 | #73 | Exceptional 1.1% |
| Jordanians | 98.5 /100 | #74 | Exceptional 1.1% |
| Immigrants | Pakistan | 98.4 /100 | #75 | Exceptional 1.1% |
| Immigrants | Burma/Myanmar | 98.2 /100 | #76 | Exceptional 1.1% |
| Immigrants | Denmark | 98.1 /100 | #77 | Exceptional 1.1% |
| West Indians | 98.0 /100 | #78 | Exceptional 1.1% |
| Hmong | 98.0 /100 | #79 | Exceptional 1.1% |
| Immigrants | Trinidad and Tobago | 98.0 /100 | #80 | Exceptional 1.1% |
| Turks | 98.0 /100 | #81 | Exceptional 1.1% |