Immigrants from Iran vs Lebanese In Labor Force | Age 16-19
COMPARE
Immigrants from Iran
Lebanese
In Labor Force | Age 16-19
In Labor Force | Age 16-19 Comparison
Immigrants from Iran
Lebanese
32.0%
IN LABOR FORCE | AGE 16-19
0.0/ 100
METRIC RATING
310th/ 347
METRIC RANK
38.6%
IN LABOR FORCE | AGE 16-19
98.7/ 100
METRIC RATING
109th/ 347
METRIC RANK
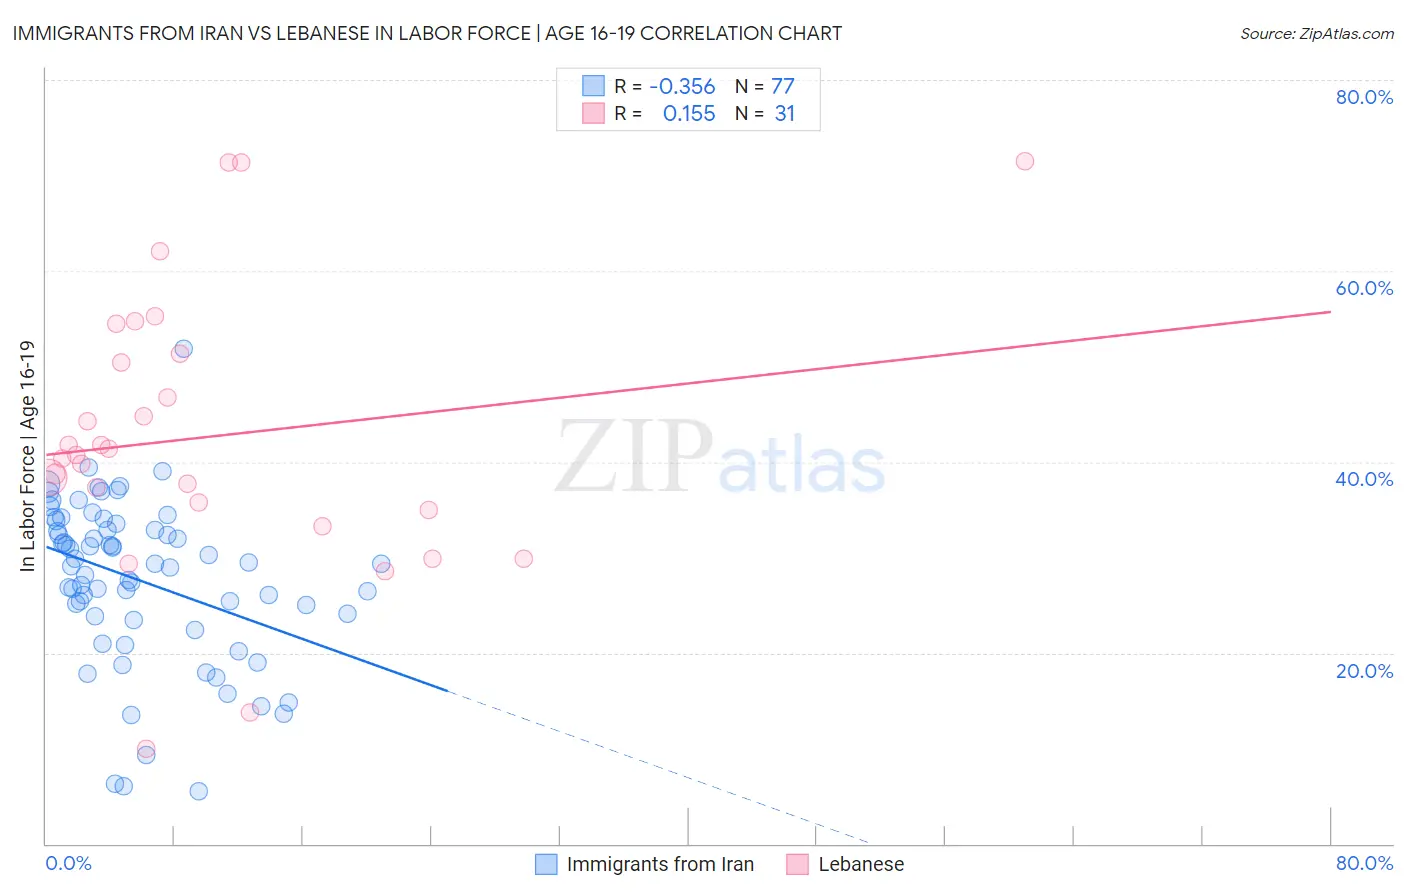
Immigrants from Iran vs Lebanese In Labor Force | Age 16-19 Correlation Chart
The statistical analysis conducted on geographies consisting of 279,510,486 people shows a mild negative correlation between the proportion of Immigrants from Iran and labor force participation rate among population between the ages 16 and 19 in the United States with a correlation coefficient (R) of -0.356 and weighted average of 32.0%. Similarly, the statistical analysis conducted on geographies consisting of 401,057,064 people shows a poor positive correlation between the proportion of Lebanese and labor force participation rate among population between the ages 16 and 19 in the United States with a correlation coefficient (R) of 0.155 and weighted average of 38.6%, a difference of 20.6%.
In Labor Force | Age 16-19 Correlation Summary
| Measurement | Immigrants from Iran | Lebanese |
| Minimum | 5.5% | 10.0% |
| Maximum | 51.8% | 71.5% |
| Range | 46.3% | 61.5% |
| Mean | 27.6% | 42.6% |
| Median | 29.3% | 40.7% |
| Interquartile 25% (IQ1) | 23.6% | 34.9% |
| Interquartile 75% (IQ3) | 33.2% | 51.3% |
| Interquartile Range (IQR) | 9.6% | 16.4% |
| Standard Deviation (Sample) | 8.5% | 14.6% |
| Standard Deviation (Population) | 8.5% | 14.3% |
Similar Demographics by In Labor Force | Age 16-19
Demographics Similar to Immigrants from Iran by In Labor Force | Age 16-19
In terms of in labor force | age 16-19, the demographic groups most similar to Immigrants from Iran are Immigrants from Eastern Asia (32.0%, a difference of 0.14%), Navajo (32.1%, a difference of 0.32%), Indian (Asian) (31.9%, a difference of 0.37%), Immigrants from Belize (31.8%, a difference of 0.51%), and Hopi (31.8%, a difference of 0.51%).
| Demographics | Rating | Rank | In Labor Force | Age 16-19 |
| Immigrants | Dominica | 0.0 /100 | #303 | Tragic 32.5% |
| Israelis | 0.0 /100 | #304 | Tragic 32.4% |
| Nicaraguans | 0.0 /100 | #305 | Tragic 32.4% |
| Spanish American Indians | 0.0 /100 | #306 | Tragic 32.4% |
| Immigrants | Jamaica | 0.0 /100 | #307 | Tragic 32.2% |
| Navajo | 0.0 /100 | #308 | Tragic 32.1% |
| Immigrants | Eastern Asia | 0.0 /100 | #309 | Tragic 32.0% |
| Immigrants | Iran | 0.0 /100 | #310 | Tragic 32.0% |
| Indians (Asian) | 0.0 /100 | #311 | Tragic 31.9% |
| Immigrants | Belize | 0.0 /100 | #312 | Tragic 31.8% |
| Hopi | 0.0 /100 | #313 | Tragic 31.8% |
| Cubans | 0.0 /100 | #314 | Tragic 31.8% |
| Immigrants | West Indies | 0.0 /100 | #315 | Tragic 31.7% |
| Filipinos | 0.0 /100 | #316 | Tragic 31.7% |
| Immigrants | Nicaragua | 0.0 /100 | #317 | Tragic 31.6% |
Demographics Similar to Lebanese by In Labor Force | Age 16-19
In terms of in labor force | age 16-19, the demographic groups most similar to Lebanese are Immigrants from Ethiopia (38.6%, a difference of 0.0%), Chinese (38.6%, a difference of 0.10%), Maltese (38.5%, a difference of 0.12%), Delaware (38.6%, a difference of 0.13%), and Iraqi (38.6%, a difference of 0.15%).
| Demographics | Rating | Rank | In Labor Force | Age 16-19 |
| Zimbabweans | 99.1 /100 | #102 | Exceptional 38.7% |
| Immigrants | Cameroon | 99.0 /100 | #103 | Exceptional 38.7% |
| Immigrants | Eritrea | 99.0 /100 | #104 | Exceptional 38.7% |
| Iraqis | 98.9 /100 | #105 | Exceptional 38.6% |
| Delaware | 98.8 /100 | #106 | Exceptional 38.6% |
| Chinese | 98.8 /100 | #107 | Exceptional 38.6% |
| Immigrants | Ethiopia | 98.7 /100 | #108 | Exceptional 38.6% |
| Lebanese | 98.7 /100 | #109 | Exceptional 38.6% |
| Maltese | 98.6 /100 | #110 | Exceptional 38.5% |
| Crow | 98.5 /100 | #111 | Exceptional 38.5% |
| Immigrants | Scotland | 98.5 /100 | #112 | Exceptional 38.5% |
| Sub-Saharan Africans | 98.3 /100 | #113 | Exceptional 38.4% |
| Hawaiians | 98.2 /100 | #114 | Exceptional 38.4% |
| Bulgarians | 97.9 /100 | #115 | Exceptional 38.3% |
| Colville | 97.9 /100 | #116 | Exceptional 38.3% |