Immigrants from Iran vs Lebanese 7th Grade
COMPARE
Immigrants from Iran
Lebanese
7th Grade
7th Grade Comparison
Immigrants from Iran
Lebanese
96.0%
7TH GRADE
47.8/ 100
METRIC RATING
179th/ 347
METRIC RANK
96.7%
7TH GRADE
98.8/ 100
METRIC RATING
94th/ 347
METRIC RANK
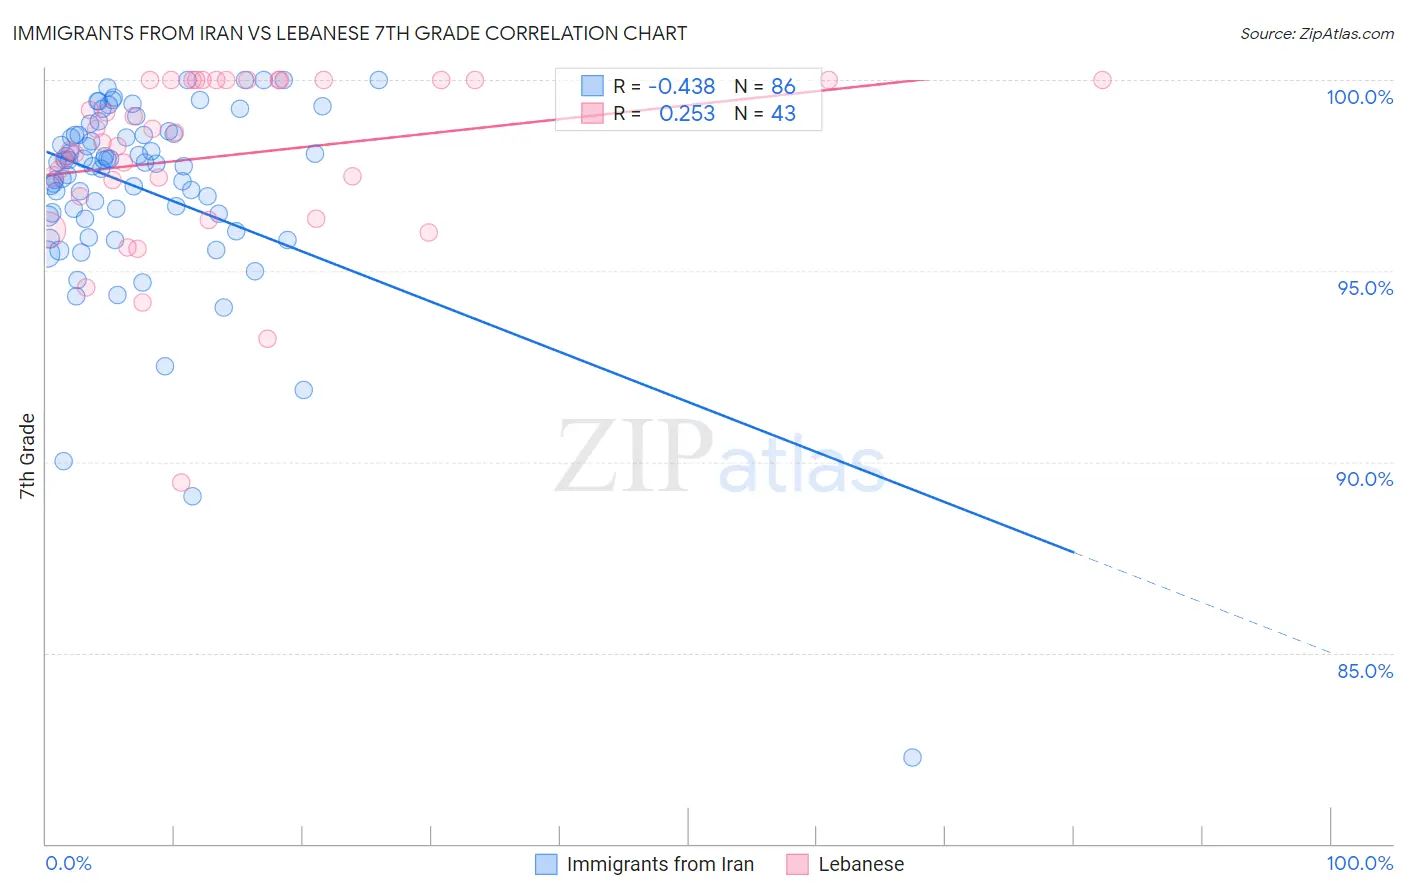
Immigrants from Iran vs Lebanese 7th Grade Correlation Chart
The statistical analysis conducted on geographies consisting of 279,867,553 people shows a moderate negative correlation between the proportion of Immigrants from Iran and percentage of population with at least 7th grade education in the United States with a correlation coefficient (R) of -0.438 and weighted average of 96.0%. Similarly, the statistical analysis conducted on geographies consisting of 401,571,113 people shows a weak positive correlation between the proportion of Lebanese and percentage of population with at least 7th grade education in the United States with a correlation coefficient (R) of 0.253 and weighted average of 96.7%, a difference of 0.69%.
7th Grade Correlation Summary
| Measurement | Immigrants from Iran | Lebanese |
| Minimum | 82.3% | 89.5% |
| Maximum | 100.0% | 100.0% |
| Range | 17.7% | 10.5% |
| Mean | 97.1% | 98.0% |
| Median | 97.8% | 98.4% |
| Interquartile 25% (IQ1) | 96.4% | 97.0% |
| Interquartile 75% (IQ3) | 98.6% | 100.0% |
| Interquartile Range (IQR) | 2.1% | 3.0% |
| Standard Deviation (Sample) | 2.6% | 2.3% |
| Standard Deviation (Population) | 2.6% | 2.2% |
Similar Demographics by 7th Grade
Demographics Similar to Immigrants from Iran by 7th Grade
In terms of 7th grade, the demographic groups most similar to Immigrants from Iran are Marshallese (96.0%, a difference of 0.0%), Mongolian (96.0%, a difference of 0.010%), Black/African American (96.0%, a difference of 0.010%), Chilean (96.0%, a difference of 0.010%), and Immigrants from Korea (96.0%, a difference of 0.010%).
| Demographics | Rating | Rank | 7th Grade |
| Venezuelans | 51.4 /100 | #172 | Average 96.0% |
| Immigrants | Albania | 50.4 /100 | #173 | Average 96.0% |
| Mongolians | 50.0 /100 | #174 | Average 96.0% |
| Blacks/African Americans | 49.5 /100 | #175 | Average 96.0% |
| Chileans | 49.3 /100 | #176 | Average 96.0% |
| Immigrants | Korea | 49.2 /100 | #177 | Average 96.0% |
| Marshallese | 48.4 /100 | #178 | Average 96.0% |
| Immigrants | Iran | 47.8 /100 | #179 | Average 96.0% |
| Immigrants | Brazil | 46.8 /100 | #180 | Average 96.0% |
| Pakistanis | 44.5 /100 | #181 | Average 96.0% |
| Iraqis | 41.2 /100 | #182 | Average 96.0% |
| Immigrants | Spain | 38.8 /100 | #183 | Fair 96.0% |
| Sierra Leoneans | 37.5 /100 | #184 | Fair 96.0% |
| Brazilians | 37.3 /100 | #185 | Fair 96.0% |
| Immigrants | Iraq | 36.1 /100 | #186 | Fair 96.0% |
Demographics Similar to Lebanese by 7th Grade
In terms of 7th grade, the demographic groups most similar to Lebanese are Immigrants from Australia (96.7%, a difference of 0.0%), Potawatomi (96.7%, a difference of 0.010%), Immigrants from Denmark (96.7%, a difference of 0.010%), Immigrants from South Africa (96.7%, a difference of 0.020%), and Osage (96.7%, a difference of 0.020%).
| Demographics | Rating | Rank | 7th Grade |
| Immigrants | Belgium | 99.0 /100 | #87 | Exceptional 96.7% |
| Puget Sound Salish | 99.0 /100 | #88 | Exceptional 96.7% |
| Cree | 99.0 /100 | #89 | Exceptional 96.7% |
| Immigrants | South Africa | 98.9 /100 | #90 | Exceptional 96.7% |
| Osage | 98.9 /100 | #91 | Exceptional 96.7% |
| Immigrants | Western Europe | 98.9 /100 | #92 | Exceptional 96.7% |
| Potawatomi | 98.9 /100 | #93 | Exceptional 96.7% |
| Lebanese | 98.8 /100 | #94 | Exceptional 96.7% |
| Immigrants | Australia | 98.8 /100 | #95 | Exceptional 96.7% |
| Immigrants | Denmark | 98.7 /100 | #96 | Exceptional 96.7% |
| Immigrants | Germany | 98.7 /100 | #97 | Exceptional 96.7% |
| Immigrants | Sweden | 98.7 /100 | #98 | Exceptional 96.7% |
| Menominee | 98.7 /100 | #99 | Exceptional 96.7% |
| German Russians | 98.6 /100 | #100 | Exceptional 96.7% |
| Thais | 98.6 /100 | #101 | Exceptional 96.7% |