Immigrants from Iran vs Lebanese Master's Degree
COMPARE
Immigrants from Iran
Lebanese
Master's Degree
Master's Degree Comparison
Immigrants from Iran
Lebanese
21.6%
MASTER'S DEGREE
100.0/ 100
METRIC RATING
10th/ 347
METRIC RANK
16.5%
MASTER'S DEGREE
96.4/ 100
METRIC RATING
120th/ 347
METRIC RANK
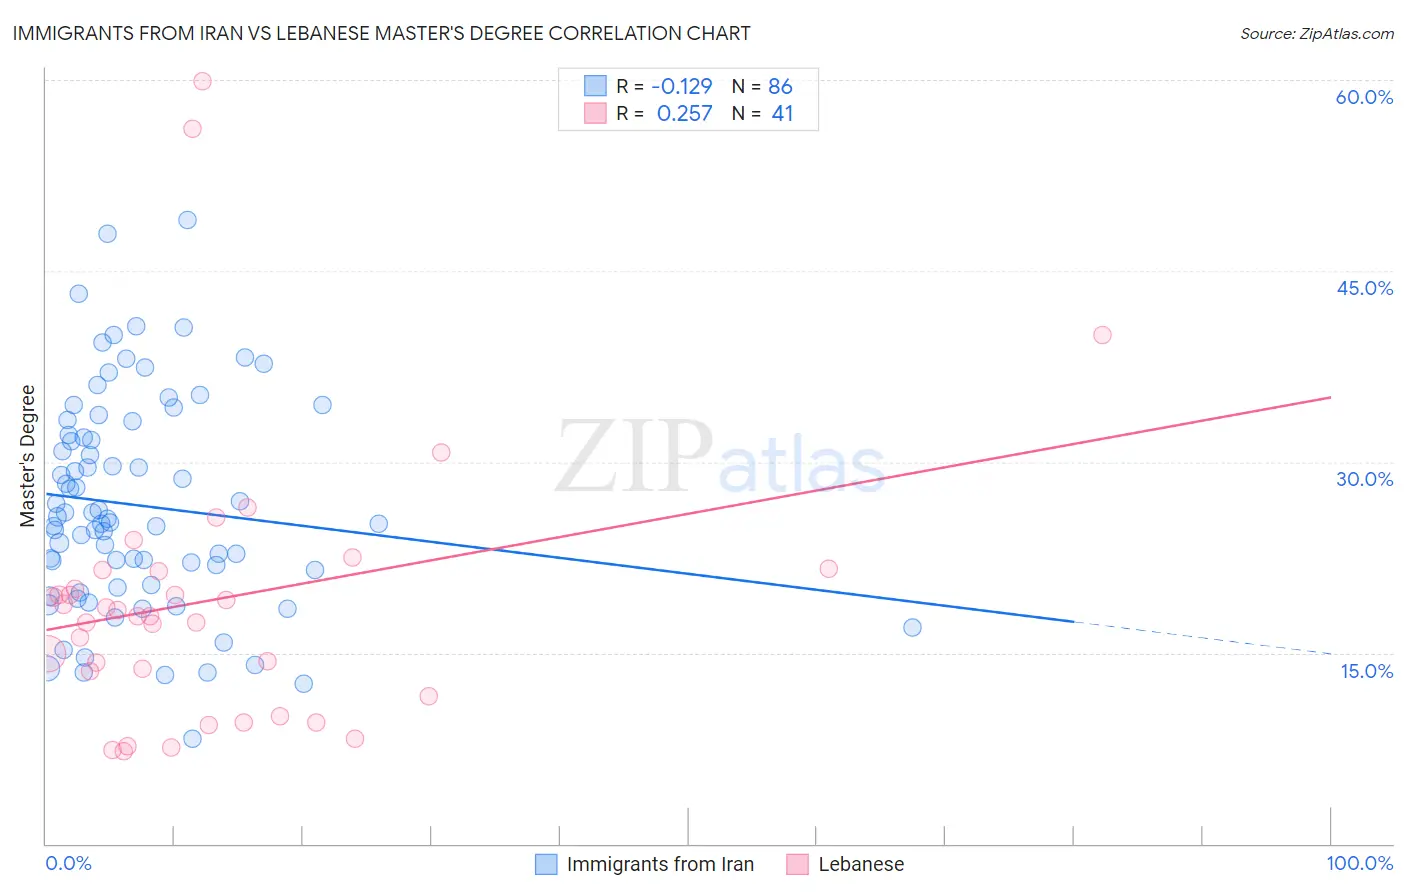
Immigrants from Iran vs Lebanese Master's Degree Correlation Chart
The statistical analysis conducted on geographies consisting of 279,879,707 people shows a poor negative correlation between the proportion of Immigrants from Iran and percentage of population with at least master's degree education in the United States with a correlation coefficient (R) of -0.129 and weighted average of 21.6%. Similarly, the statistical analysis conducted on geographies consisting of 401,481,649 people shows a weak positive correlation between the proportion of Lebanese and percentage of population with at least master's degree education in the United States with a correlation coefficient (R) of 0.257 and weighted average of 16.5%, a difference of 31.1%.
Master's Degree Correlation Summary
| Measurement | Immigrants from Iran | Lebanese |
| Minimum | 8.2% | 7.3% |
| Maximum | 49.0% | 60.0% |
| Range | 40.8% | 52.6% |
| Mean | 26.6% | 19.2% |
| Median | 25.4% | 17.9% |
| Interquartile 25% (IQ1) | 20.3% | 12.6% |
| Interquartile 75% (IQ3) | 32.1% | 21.4% |
| Interquartile Range (IQR) | 11.8% | 8.9% |
| Standard Deviation (Sample) | 8.4% | 11.2% |
| Standard Deviation (Population) | 8.4% | 11.0% |
Similar Demographics by Master's Degree
Demographics Similar to Immigrants from Iran by Master's Degree
In terms of master's degree, the demographic groups most similar to Immigrants from Iran are Thai (21.7%, a difference of 0.41%), Cypriot (21.8%, a difference of 0.75%), Immigrants from China (21.2%, a difference of 2.1%), Eastern European (21.1%, a difference of 2.4%), and Iranian (22.3%, a difference of 3.0%).
| Demographics | Rating | Rank | Master's Degree |
| Immigrants | Israel | 100.0 /100 | #3 | Exceptional 22.6% |
| Okinawans | 100.0 /100 | #4 | Exceptional 22.6% |
| Immigrants | Taiwan | 100.0 /100 | #5 | Exceptional 22.5% |
| Immigrants | India | 100.0 /100 | #6 | Exceptional 22.3% |
| Iranians | 100.0 /100 | #7 | Exceptional 22.3% |
| Cypriots | 100.0 /100 | #8 | Exceptional 21.8% |
| Thais | 100.0 /100 | #9 | Exceptional 21.7% |
| Immigrants | Iran | 100.0 /100 | #10 | Exceptional 21.6% |
| Immigrants | China | 100.0 /100 | #11 | Exceptional 21.2% |
| Eastern Europeans | 100.0 /100 | #12 | Exceptional 21.1% |
| Immigrants | Australia | 100.0 /100 | #13 | Exceptional 20.9% |
| Immigrants | Switzerland | 100.0 /100 | #14 | Exceptional 20.9% |
| Immigrants | Eastern Asia | 100.0 /100 | #15 | Exceptional 20.8% |
| Immigrants | Belgium | 100.0 /100 | #16 | Exceptional 20.8% |
| Immigrants | South Central Asia | 100.0 /100 | #17 | Exceptional 20.7% |
Demographics Similar to Lebanese by Master's Degree
In terms of master's degree, the demographic groups most similar to Lebanese are Jordanian (16.5%, a difference of 0.10%), Afghan (16.5%, a difference of 0.20%), Brazilian (16.5%, a difference of 0.33%), British (16.4%, a difference of 0.63%), and Croatian (16.4%, a difference of 0.64%).
| Demographics | Rating | Rank | Master's Degree |
| Arabs | 97.7 /100 | #113 | Exceptional 16.7% |
| Northern Europeans | 97.6 /100 | #114 | Exceptional 16.7% |
| Immigrants | Uganda | 97.3 /100 | #115 | Exceptional 16.6% |
| Immigrants | Southern Europe | 97.2 /100 | #116 | Exceptional 16.6% |
| Immigrants | Moldova | 97.2 /100 | #117 | Exceptional 16.6% |
| Brazilians | 96.8 /100 | #118 | Exceptional 16.5% |
| Jordanians | 96.5 /100 | #119 | Exceptional 16.5% |
| Lebanese | 96.4 /100 | #120 | Exceptional 16.5% |
| Afghans | 96.2 /100 | #121 | Exceptional 16.5% |
| British | 95.6 /100 | #122 | Exceptional 16.4% |
| Croatians | 95.6 /100 | #123 | Exceptional 16.4% |
| Immigrants | Eritrea | 95.5 /100 | #124 | Exceptional 16.4% |
| Italians | 95.4 /100 | #125 | Exceptional 16.4% |
| Immigrants | Eastern Africa | 95.2 /100 | #126 | Exceptional 16.3% |
| Palestinians | 94.8 /100 | #127 | Exceptional 16.3% |