Immigrants from Iran vs Spanish In Labor Force | Age 16-19
COMPARE
Immigrants from Iran
Spanish
In Labor Force | Age 16-19
In Labor Force | Age 16-19 Comparison
Immigrants from Iran
Spanish
32.0%
IN LABOR FORCE | AGE 16-19
0.0/ 100
METRIC RATING
310th/ 347
METRIC RANK
39.3%
IN LABOR FORCE | AGE 16-19
99.7/ 100
METRIC RATING
83rd/ 347
METRIC RANK
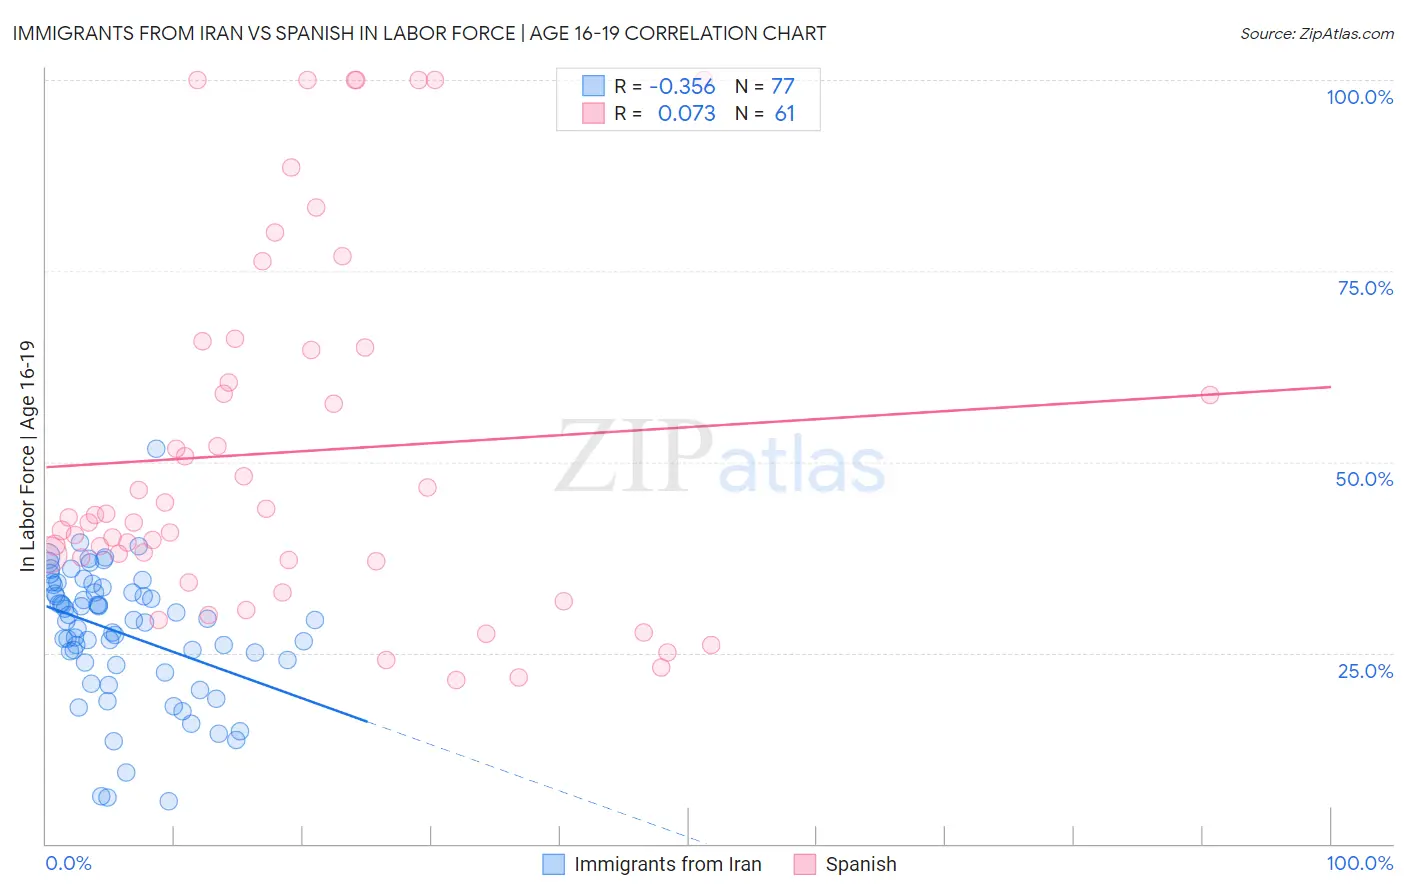
Immigrants from Iran vs Spanish In Labor Force | Age 16-19 Correlation Chart
The statistical analysis conducted on geographies consisting of 279,510,486 people shows a mild negative correlation between the proportion of Immigrants from Iran and labor force participation rate among population between the ages 16 and 19 in the United States with a correlation coefficient (R) of -0.356 and weighted average of 32.0%. Similarly, the statistical analysis conducted on geographies consisting of 421,181,243 people shows a slight positive correlation between the proportion of Spanish and labor force participation rate among population between the ages 16 and 19 in the United States with a correlation coefficient (R) of 0.073 and weighted average of 39.3%, a difference of 22.8%.
In Labor Force | Age 16-19 Correlation Summary
| Measurement | Immigrants from Iran | Spanish |
| Minimum | 5.5% | 21.4% |
| Maximum | 51.8% | 100.0% |
| Range | 46.3% | 78.6% |
| Mean | 27.6% | 51.3% |
| Median | 29.3% | 42.7% |
| Interquartile 25% (IQ1) | 23.6% | 37.1% |
| Interquartile 75% (IQ3) | 33.2% | 64.9% |
| Interquartile Range (IQR) | 9.6% | 27.8% |
| Standard Deviation (Sample) | 8.5% | 23.5% |
| Standard Deviation (Population) | 8.5% | 23.3% |
Similar Demographics by In Labor Force | Age 16-19
Demographics Similar to Immigrants from Iran by In Labor Force | Age 16-19
In terms of in labor force | age 16-19, the demographic groups most similar to Immigrants from Iran are Immigrants from Eastern Asia (32.0%, a difference of 0.14%), Navajo (32.1%, a difference of 0.32%), Indian (Asian) (31.9%, a difference of 0.37%), Immigrants from Belize (31.8%, a difference of 0.51%), and Hopi (31.8%, a difference of 0.51%).
| Demographics | Rating | Rank | In Labor Force | Age 16-19 |
| Immigrants | Dominica | 0.0 /100 | #303 | Tragic 32.5% |
| Israelis | 0.0 /100 | #304 | Tragic 32.4% |
| Nicaraguans | 0.0 /100 | #305 | Tragic 32.4% |
| Spanish American Indians | 0.0 /100 | #306 | Tragic 32.4% |
| Immigrants | Jamaica | 0.0 /100 | #307 | Tragic 32.2% |
| Navajo | 0.0 /100 | #308 | Tragic 32.1% |
| Immigrants | Eastern Asia | 0.0 /100 | #309 | Tragic 32.0% |
| Immigrants | Iran | 0.0 /100 | #310 | Tragic 32.0% |
| Indians (Asian) | 0.0 /100 | #311 | Tragic 31.9% |
| Immigrants | Belize | 0.0 /100 | #312 | Tragic 31.8% |
| Hopi | 0.0 /100 | #313 | Tragic 31.8% |
| Cubans | 0.0 /100 | #314 | Tragic 31.8% |
| Immigrants | West Indies | 0.0 /100 | #315 | Tragic 31.7% |
| Filipinos | 0.0 /100 | #316 | Tragic 31.7% |
| Immigrants | Nicaragua | 0.0 /100 | #317 | Tragic 31.6% |
Demographics Similar to Spanish by In Labor Force | Age 16-19
In terms of in labor force | age 16-19, the demographic groups most similar to Spanish are Basque (39.3%, a difference of 0.020%), Shoshone (39.3%, a difference of 0.080%), Immigrants from Uganda (39.2%, a difference of 0.13%), Creek (39.1%, a difference of 0.28%), and Samoan (39.1%, a difference of 0.30%).
| Demographics | Rating | Rank | In Labor Force | Age 16-19 |
| Malaysians | 99.9 /100 | #76 | Exceptional 39.7% |
| Immigrants | Portugal | 99.9 /100 | #77 | Exceptional 39.7% |
| Austrians | 99.8 /100 | #78 | Exceptional 39.5% |
| Marshallese | 99.8 /100 | #79 | Exceptional 39.5% |
| Immigrants | Iraq | 99.8 /100 | #80 | Exceptional 39.4% |
| Shoshone | 99.7 /100 | #81 | Exceptional 39.3% |
| Basques | 99.7 /100 | #82 | Exceptional 39.3% |
| Spanish | 99.7 /100 | #83 | Exceptional 39.3% |
| Immigrants | Uganda | 99.7 /100 | #84 | Exceptional 39.2% |
| Creek | 99.6 /100 | #85 | Exceptional 39.1% |
| Samoans | 99.6 /100 | #86 | Exceptional 39.1% |
| Immigrants | Germany | 99.6 /100 | #87 | Exceptional 39.1% |
| Puget Sound Salish | 99.6 /100 | #88 | Exceptional 39.1% |
| Alaska Natives | 99.6 /100 | #89 | Exceptional 39.1% |
| Immigrants | Burma/Myanmar | 99.5 /100 | #90 | Exceptional 39.0% |