Colville vs Bermudan In Labor Force | Age 30-34
COMPARE
Colville
Bermudan
In Labor Force | Age 30-34
In Labor Force | Age 30-34 Comparison
Colville
Bermudans
80.7%
IN LABOR FORCE | AGE 30-34
0.0/ 100
METRIC RATING
327th/ 347
METRIC RANK
85.9%
IN LABOR FORCE | AGE 30-34
100.0/ 100
METRIC RATING
22nd/ 347
METRIC RANK
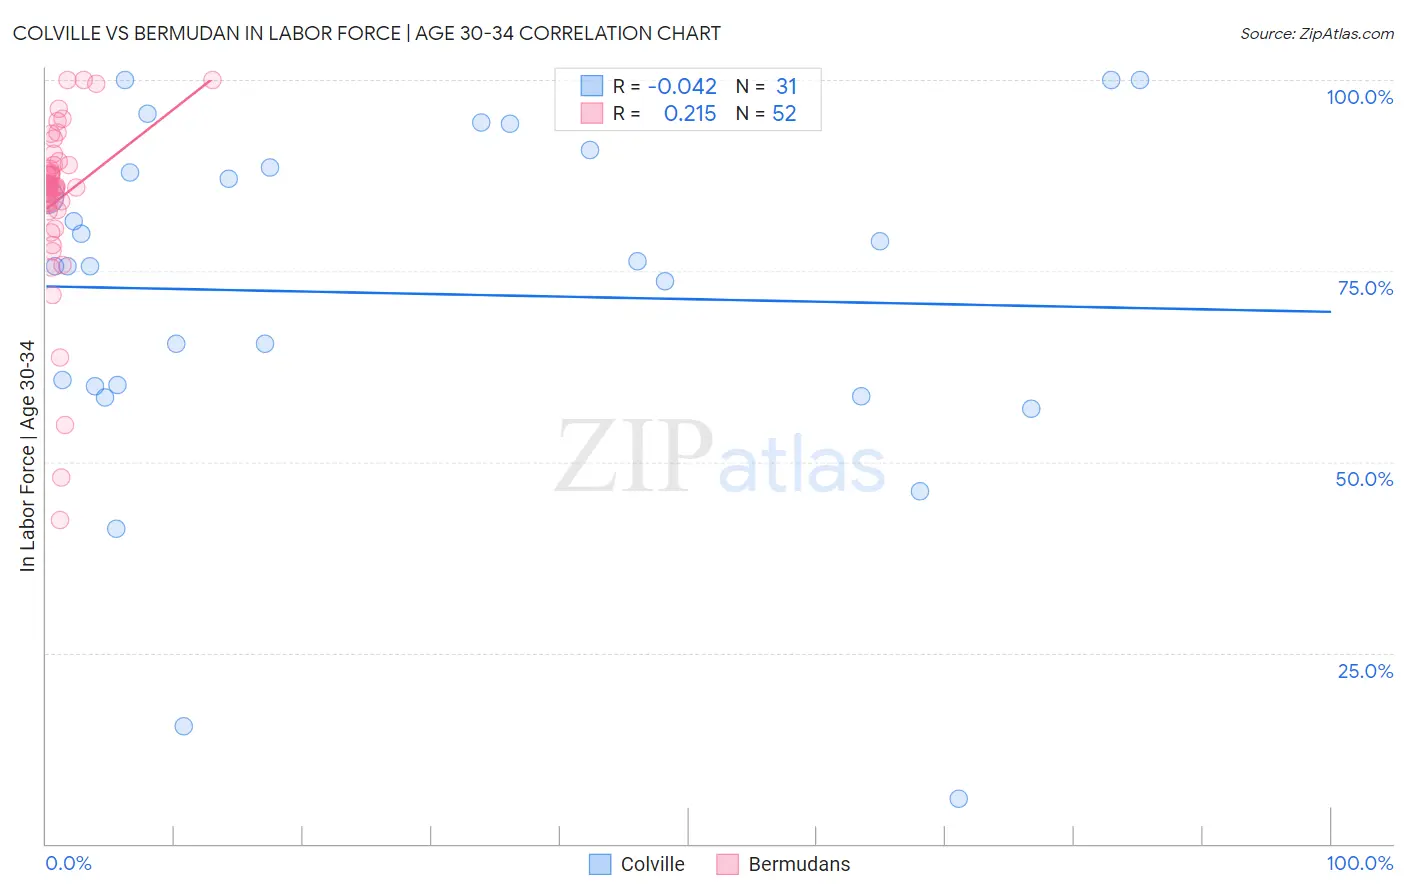
Colville vs Bermudan In Labor Force | Age 30-34 Correlation Chart
The statistical analysis conducted on geographies consisting of 34,677,066 people shows no correlation between the proportion of Colville and labor force participation rate among population between the ages 30 and 34 in the United States with a correlation coefficient (R) of -0.042 and weighted average of 80.7%. Similarly, the statistical analysis conducted on geographies consisting of 55,725,453 people shows a weak positive correlation between the proportion of Bermudans and labor force participation rate among population between the ages 30 and 34 in the United States with a correlation coefficient (R) of 0.215 and weighted average of 85.9%, a difference of 6.5%.
In Labor Force | Age 30-34 Correlation Summary
| Measurement | Colville | Bermudan |
| Minimum | 5.9% | 42.4% |
| Maximum | 100.0% | 100.0% |
| Range | 94.1% | 57.6% |
| Mean | 72.1% | 84.4% |
| Median | 75.7% | 86.0% |
| Interquartile 25% (IQ1) | 59.8% | 83.3% |
| Interquartile 75% (IQ3) | 88.6% | 88.8% |
| Interquartile Range (IQR) | 28.8% | 5.5% |
| Standard Deviation (Sample) | 22.9% | 11.4% |
| Standard Deviation (Population) | 22.5% | 11.2% |
Similar Demographics by In Labor Force | Age 30-34
Demographics Similar to Colville by In Labor Force | Age 30-34
In terms of in labor force | age 30-34, the demographic groups most similar to Colville are Seminole (80.8%, a difference of 0.19%), Dutch West Indian (81.0%, a difference of 0.41%), Sioux (80.4%, a difference of 0.41%), Creek (80.4%, a difference of 0.41%), and Cheyenne (81.1%, a difference of 0.57%).
| Demographics | Rating | Rank | In Labor Force | Age 30-34 |
| Yaqui | 0.0 /100 | #320 | Tragic 81.4% |
| Alaska Natives | 0.0 /100 | #321 | Tragic 81.3% |
| Puerto Ricans | 0.0 /100 | #322 | Tragic 81.2% |
| Paiute | 0.0 /100 | #323 | Tragic 81.2% |
| Cheyenne | 0.0 /100 | #324 | Tragic 81.1% |
| Dutch West Indians | 0.0 /100 | #325 | Tragic 81.0% |
| Seminole | 0.0 /100 | #326 | Tragic 80.8% |
| Colville | 0.0 /100 | #327 | Tragic 80.7% |
| Sioux | 0.0 /100 | #328 | Tragic 80.4% |
| Creek | 0.0 /100 | #329 | Tragic 80.4% |
| Pueblo | 0.0 /100 | #330 | Tragic 80.0% |
| Houma | 0.0 /100 | #331 | Tragic 79.9% |
| Kiowa | 0.0 /100 | #332 | Tragic 79.8% |
| Inupiat | 0.0 /100 | #333 | Tragic 79.7% |
| Hopi | 0.0 /100 | #334 | Tragic 79.3% |
Demographics Similar to Bermudans by In Labor Force | Age 30-34
In terms of in labor force | age 30-34, the demographic groups most similar to Bermudans are Estonian (85.9%, a difference of 0.0%), Immigrants from Eritrea (85.9%, a difference of 0.010%), Bulgarian (86.0%, a difference of 0.020%), Immigrants from Bulgaria (86.0%, a difference of 0.020%), and Immigrants from North Macedonia (85.9%, a difference of 0.020%).
| Demographics | Rating | Rank | In Labor Force | Age 30-34 |
| Immigrants | Albania | 100.0 /100 | #15 | Exceptional 86.1% |
| Latvians | 100.0 /100 | #16 | Exceptional 86.0% |
| Immigrants | Cameroon | 100.0 /100 | #17 | Exceptional 86.0% |
| Immigrants | Sierra Leone | 100.0 /100 | #18 | Exceptional 86.0% |
| Sierra Leoneans | 100.0 /100 | #19 | Exceptional 86.0% |
| Bulgarians | 100.0 /100 | #20 | Exceptional 86.0% |
| Immigrants | Bulgaria | 100.0 /100 | #21 | Exceptional 86.0% |
| Bermudans | 100.0 /100 | #22 | Exceptional 85.9% |
| Estonians | 100.0 /100 | #23 | Exceptional 85.9% |
| Immigrants | Eritrea | 100.0 /100 | #24 | Exceptional 85.9% |
| Immigrants | North Macedonia | 100.0 /100 | #25 | Exceptional 85.9% |
| Immigrants | Eastern Africa | 100.0 /100 | #26 | Exceptional 85.9% |
| Immigrants | Liberia | 100.0 /100 | #27 | Exceptional 85.9% |
| Immigrants | Latvia | 100.0 /100 | #28 | Exceptional 85.9% |
| Tsimshian | 100.0 /100 | #29 | Exceptional 85.8% |