Immigrants from Northern Europe vs Bermudan In Labor Force | Age 30-34
COMPARE
Immigrants from Northern Europe
Bermudan
In Labor Force | Age 30-34
In Labor Force | Age 30-34 Comparison
Immigrants from Northern Europe
Bermudans
85.3%
IN LABOR FORCE | AGE 30-34
98.2/ 100
METRIC RATING
87th/ 347
METRIC RANK
85.9%
IN LABOR FORCE | AGE 30-34
100.0/ 100
METRIC RATING
22nd/ 347
METRIC RANK
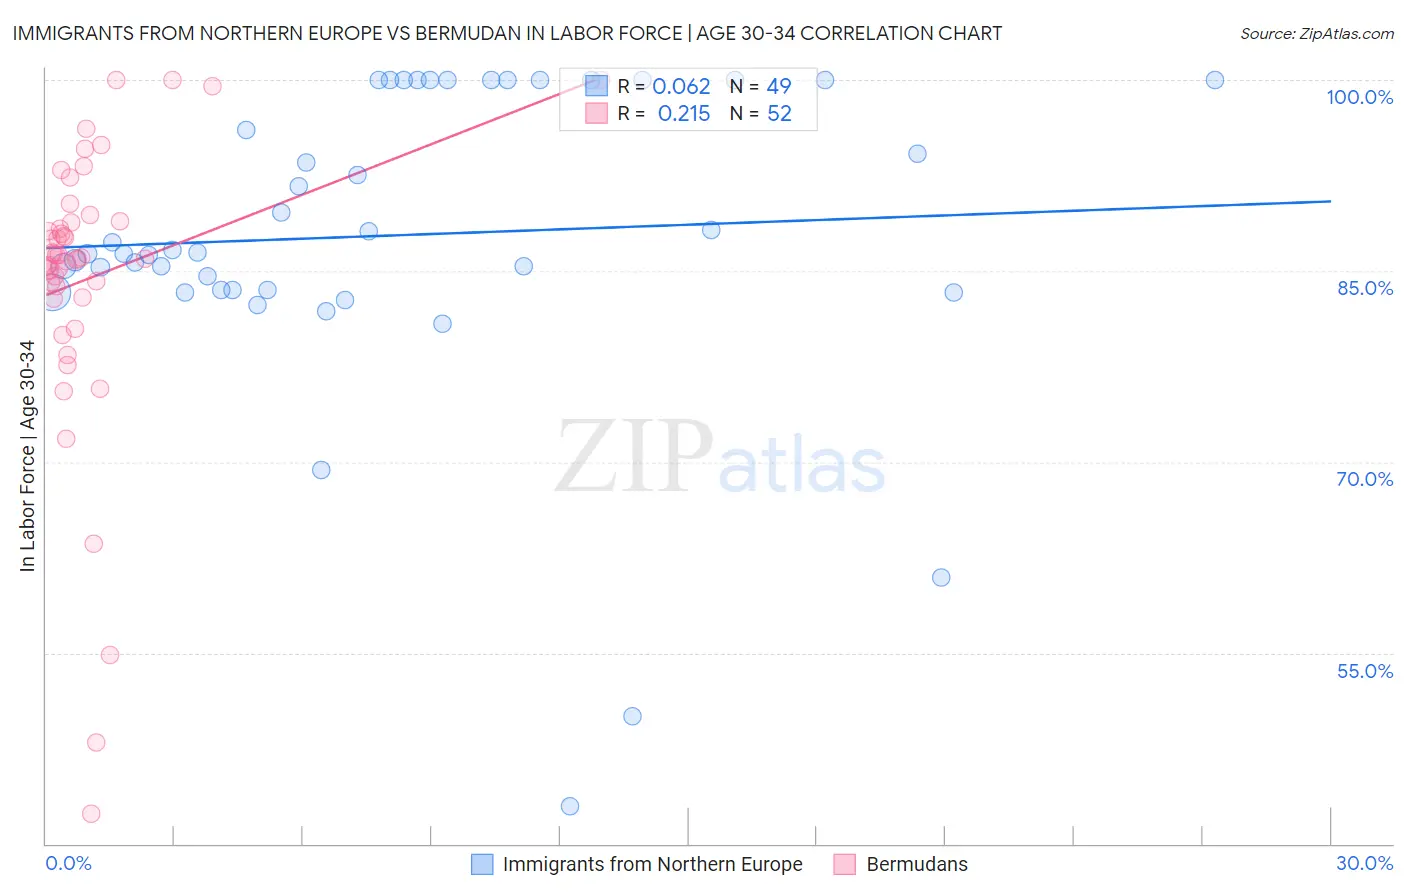
Immigrants from Northern Europe vs Bermudan In Labor Force | Age 30-34 Correlation Chart
The statistical analysis conducted on geographies consisting of 476,741,724 people shows a slight positive correlation between the proportion of Immigrants from Northern Europe and labor force participation rate among population between the ages 30 and 34 in the United States with a correlation coefficient (R) of 0.062 and weighted average of 85.3%. Similarly, the statistical analysis conducted on geographies consisting of 55,725,453 people shows a weak positive correlation between the proportion of Bermudans and labor force participation rate among population between the ages 30 and 34 in the United States with a correlation coefficient (R) of 0.215 and weighted average of 85.9%, a difference of 0.78%.
In Labor Force | Age 30-34 Correlation Summary
| Measurement | Immigrants from Northern Europe | Bermudan |
| Minimum | 42.9% | 42.4% |
| Maximum | 100.0% | 100.0% |
| Range | 57.1% | 57.6% |
| Mean | 87.8% | 84.4% |
| Median | 86.4% | 86.0% |
| Interquartile 25% (IQ1) | 83.5% | 83.3% |
| Interquartile 75% (IQ3) | 100.0% | 88.8% |
| Interquartile Range (IQR) | 16.5% | 5.5% |
| Standard Deviation (Sample) | 12.2% | 11.4% |
| Standard Deviation (Population) | 12.0% | 11.2% |
Similar Demographics by In Labor Force | Age 30-34
Demographics Similar to Immigrants from Northern Europe by In Labor Force | Age 30-34
In terms of in labor force | age 30-34, the demographic groups most similar to Immigrants from Northern Europe are Immigrants from Taiwan (85.3%, a difference of 0.0%), Immigrants from Belgium (85.3%, a difference of 0.010%), Immigrants from Kazakhstan (85.3%, a difference of 0.010%), Mongolian (85.3%, a difference of 0.030%), and Burmese (85.3%, a difference of 0.030%).
| Demographics | Rating | Rank | In Labor Force | Age 30-34 |
| Immigrants | Russia | 98.7 /100 | #80 | Exceptional 85.3% |
| Slovaks | 98.7 /100 | #81 | Exceptional 85.3% |
| Immigrants | Africa | 98.6 /100 | #82 | Exceptional 85.3% |
| Immigrants | Europe | 98.6 /100 | #83 | Exceptional 85.3% |
| Greeks | 98.6 /100 | #84 | Exceptional 85.3% |
| Mongolians | 98.5 /100 | #85 | Exceptional 85.3% |
| Immigrants | Taiwan | 98.3 /100 | #86 | Exceptional 85.3% |
| Immigrants | Northern Europe | 98.2 /100 | #87 | Exceptional 85.3% |
| Immigrants | Belgium | 98.2 /100 | #88 | Exceptional 85.3% |
| Immigrants | Kazakhstan | 98.1 /100 | #89 | Exceptional 85.3% |
| Burmese | 97.9 /100 | #90 | Exceptional 85.3% |
| Immigrants | Moldova | 97.9 /100 | #91 | Exceptional 85.3% |
| German Russians | 97.7 /100 | #92 | Exceptional 85.2% |
| Immigrants | Norway | 97.6 /100 | #93 | Exceptional 85.2% |
| Swedes | 97.5 /100 | #94 | Exceptional 85.2% |
Demographics Similar to Bermudans by In Labor Force | Age 30-34
In terms of in labor force | age 30-34, the demographic groups most similar to Bermudans are Estonian (85.9%, a difference of 0.0%), Immigrants from Eritrea (85.9%, a difference of 0.010%), Bulgarian (86.0%, a difference of 0.020%), Immigrants from Bulgaria (86.0%, a difference of 0.020%), and Immigrants from North Macedonia (85.9%, a difference of 0.020%).
| Demographics | Rating | Rank | In Labor Force | Age 30-34 |
| Immigrants | Albania | 100.0 /100 | #15 | Exceptional 86.1% |
| Latvians | 100.0 /100 | #16 | Exceptional 86.0% |
| Immigrants | Cameroon | 100.0 /100 | #17 | Exceptional 86.0% |
| Immigrants | Sierra Leone | 100.0 /100 | #18 | Exceptional 86.0% |
| Sierra Leoneans | 100.0 /100 | #19 | Exceptional 86.0% |
| Bulgarians | 100.0 /100 | #20 | Exceptional 86.0% |
| Immigrants | Bulgaria | 100.0 /100 | #21 | Exceptional 86.0% |
| Bermudans | 100.0 /100 | #22 | Exceptional 85.9% |
| Estonians | 100.0 /100 | #23 | Exceptional 85.9% |
| Immigrants | Eritrea | 100.0 /100 | #24 | Exceptional 85.9% |
| Immigrants | North Macedonia | 100.0 /100 | #25 | Exceptional 85.9% |
| Immigrants | Eastern Africa | 100.0 /100 | #26 | Exceptional 85.9% |
| Immigrants | Liberia | 100.0 /100 | #27 | Exceptional 85.9% |
| Immigrants | Latvia | 100.0 /100 | #28 | Exceptional 85.9% |
| Tsimshian | 100.0 /100 | #29 | Exceptional 85.8% |