Immigrants from Indonesia vs Colombian In Labor Force | Age 20-64
COMPARE
Immigrants from Indonesia
Colombian
In Labor Force | Age 20-64
In Labor Force | Age 20-64 Comparison
Immigrants from Indonesia
Colombians
79.6%
IN LABOR FORCE | AGE 20-64
61.8/ 100
METRIC RATING
168th/ 347
METRIC RANK
80.1%
IN LABOR FORCE | AGE 20-64
97.3/ 100
METRIC RATING
83rd/ 347
METRIC RANK
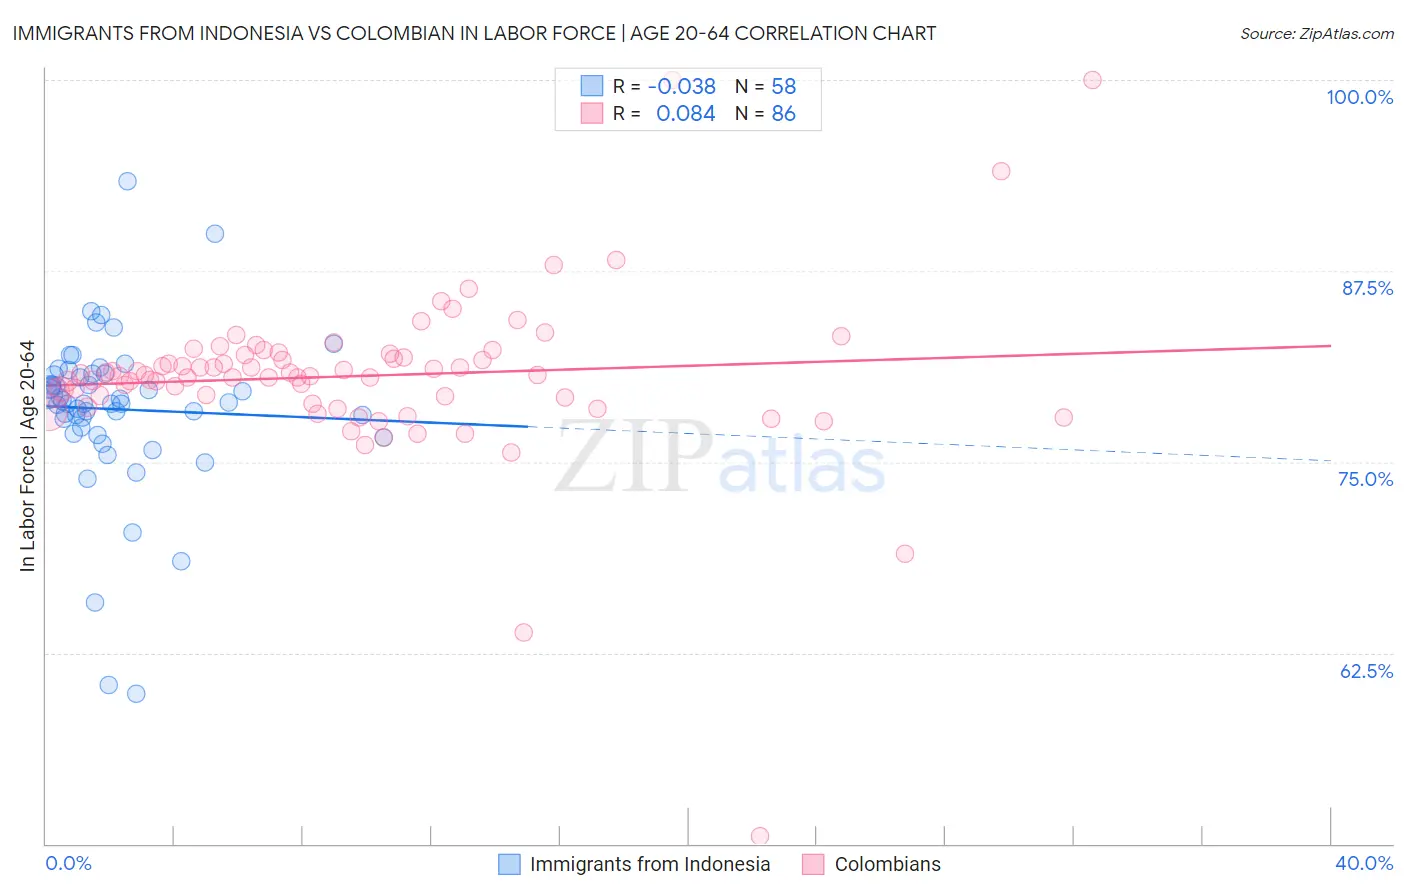
Immigrants from Indonesia vs Colombian In Labor Force | Age 20-64 Correlation Chart
The statistical analysis conducted on geographies consisting of 215,788,587 people shows no correlation between the proportion of Immigrants from Indonesia and labor force participation rate among population between the ages 20 and 64 in the United States with a correlation coefficient (R) of -0.038 and weighted average of 79.6%. Similarly, the statistical analysis conducted on geographies consisting of 419,691,663 people shows a slight positive correlation between the proportion of Colombians and labor force participation rate among population between the ages 20 and 64 in the United States with a correlation coefficient (R) of 0.084 and weighted average of 80.1%, a difference of 0.62%.
In Labor Force | Age 20-64 Correlation Summary
| Measurement | Immigrants from Indonesia | Colombian |
| Minimum | 59.8% | 50.5% |
| Maximum | 93.4% | 100.0% |
| Range | 33.6% | 49.5% |
| Mean | 78.4% | 80.6% |
| Median | 78.9% | 80.7% |
| Interquartile 25% (IQ1) | 77.2% | 79.2% |
| Interquartile 75% (IQ3) | 80.8% | 82.0% |
| Interquartile Range (IQR) | 3.6% | 2.8% |
| Standard Deviation (Sample) | 5.4% | 5.7% |
| Standard Deviation (Population) | 5.4% | 5.6% |
Similar Demographics by In Labor Force | Age 20-64
Demographics Similar to Immigrants from Indonesia by In Labor Force | Age 20-64
In terms of in labor force | age 20-64, the demographic groups most similar to Immigrants from Indonesia are Immigrants from Iraq (79.6%, a difference of 0.0%), Okinawan (79.6%, a difference of 0.010%), Immigrants from Costa Rica (79.7%, a difference of 0.020%), Immigrants from Burma/Myanmar (79.7%, a difference of 0.020%), and Nigerian (79.7%, a difference of 0.020%).
| Demographics | Rating | Rank | In Labor Force | Age 20-64 |
| South Africans | 66.2 /100 | #161 | Good 79.7% |
| Germans | 65.2 /100 | #162 | Good 79.7% |
| Immigrants | Costa Rica | 64.6 /100 | #163 | Good 79.7% |
| Immigrants | Burma/Myanmar | 64.4 /100 | #164 | Good 79.7% |
| Nigerians | 64.0 /100 | #165 | Good 79.7% |
| Okinawans | 62.7 /100 | #166 | Good 79.6% |
| Immigrants | Iraq | 62.0 /100 | #167 | Good 79.6% |
| Immigrants | Indonesia | 61.8 /100 | #168 | Good 79.6% |
| Laotians | 58.4 /100 | #169 | Average 79.6% |
| Slavs | 54.0 /100 | #170 | Average 79.6% |
| Immigrants | Switzerland | 53.3 /100 | #171 | Average 79.6% |
| Immigrants | Belgium | 53.1 /100 | #172 | Average 79.6% |
| Immigrants | Scotland | 52.4 /100 | #173 | Average 79.6% |
| Syrians | 50.0 /100 | #174 | Average 79.6% |
| Cubans | 46.1 /100 | #175 | Average 79.5% |
Demographics Similar to Colombians by In Labor Force | Age 20-64
In terms of in labor force | age 20-64, the demographic groups most similar to Colombians are German Russian (80.1%, a difference of 0.0%), Immigrants from Japan (80.1%, a difference of 0.0%), Immigrants from Latvia (80.1%, a difference of 0.0%), Jordanian (80.1%, a difference of 0.010%), and Immigrants from Egypt (80.1%, a difference of 0.010%).
| Demographics | Rating | Rank | In Labor Force | Age 20-64 |
| Egyptians | 97.8 /100 | #76 | Exceptional 80.2% |
| Immigrants | Colombia | 97.8 /100 | #77 | Exceptional 80.2% |
| Immigrants | Romania | 97.8 /100 | #78 | Exceptional 80.2% |
| Asians | 97.7 /100 | #79 | Exceptional 80.2% |
| Immigrants | Croatia | 97.6 /100 | #80 | Exceptional 80.1% |
| German Russians | 97.3 /100 | #81 | Exceptional 80.1% |
| Immigrants | Japan | 97.3 /100 | #82 | Exceptional 80.1% |
| Colombians | 97.3 /100 | #83 | Exceptional 80.1% |
| Immigrants | Latvia | 97.2 /100 | #84 | Exceptional 80.1% |
| Jordanians | 97.2 /100 | #85 | Exceptional 80.1% |
| Immigrants | Egypt | 97.1 /100 | #86 | Exceptional 80.1% |
| Croatians | 97.1 /100 | #87 | Exceptional 80.1% |
| Chileans | 97.0 /100 | #88 | Exceptional 80.1% |
| Immigrants | Venezuela | 96.8 /100 | #89 | Exceptional 80.1% |
| Poles | 96.8 /100 | #90 | Exceptional 80.1% |