Immigrants from Canada vs Colombian In Labor Force | Age 20-64
COMPARE
Immigrants from Canada
Colombian
In Labor Force | Age 20-64
In Labor Force | Age 20-64 Comparison
Immigrants from Canada
Colombians
79.0%
IN LABOR FORCE | AGE 20-64
3.2/ 100
METRIC RATING
234th/ 347
METRIC RANK
80.1%
IN LABOR FORCE | AGE 20-64
97.3/ 100
METRIC RATING
83rd/ 347
METRIC RANK
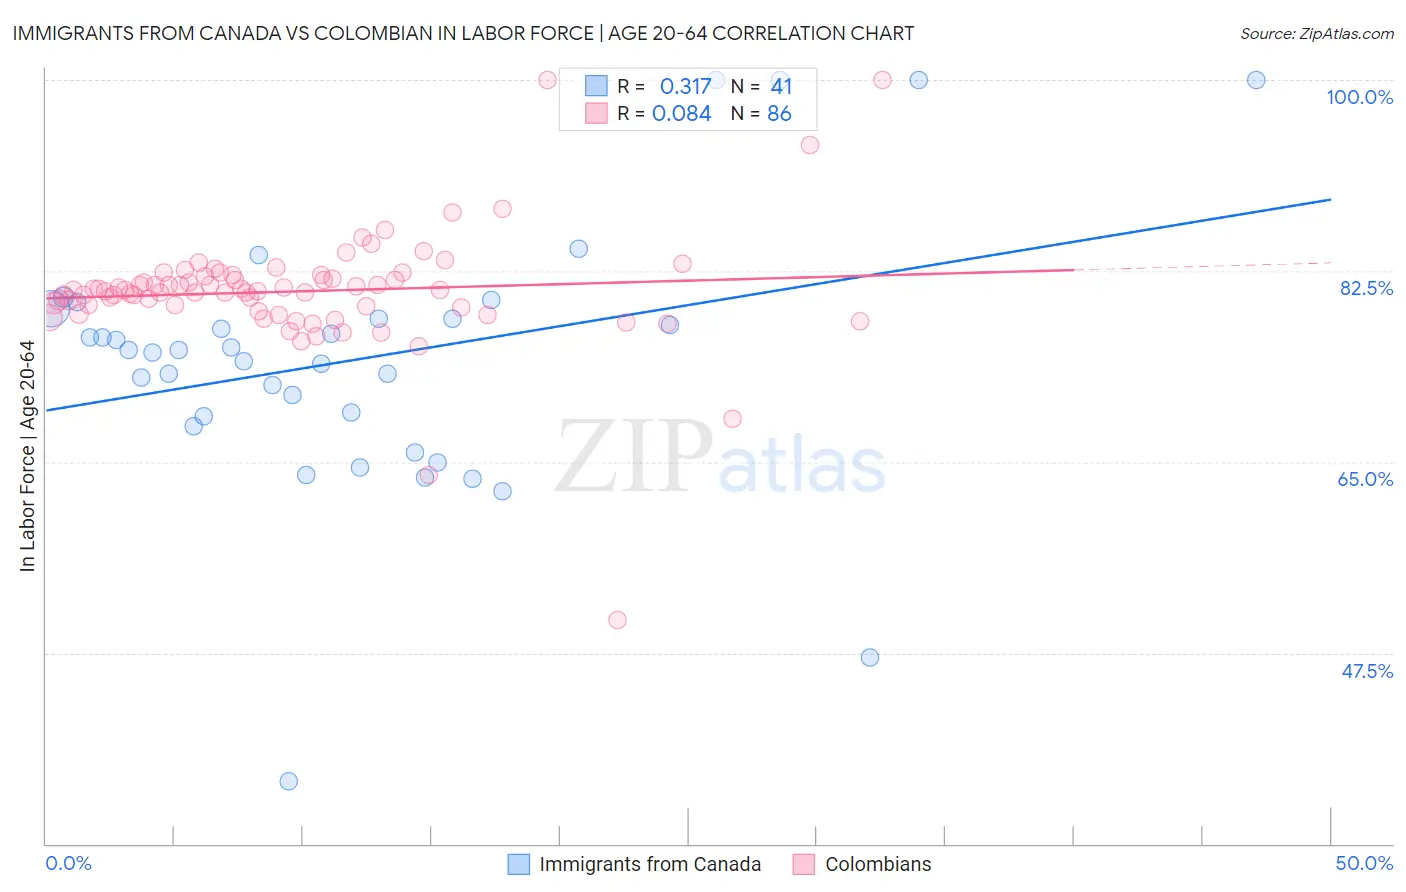
Immigrants from Canada vs Colombian In Labor Force | Age 20-64 Correlation Chart
The statistical analysis conducted on geographies consisting of 459,408,758 people shows a mild positive correlation between the proportion of Immigrants from Canada and labor force participation rate among population between the ages 20 and 64 in the United States with a correlation coefficient (R) of 0.317 and weighted average of 79.0%. Similarly, the statistical analysis conducted on geographies consisting of 419,691,663 people shows a slight positive correlation between the proportion of Colombians and labor force participation rate among population between the ages 20 and 64 in the United States with a correlation coefficient (R) of 0.084 and weighted average of 80.1%, a difference of 1.4%.
In Labor Force | Age 20-64 Correlation Summary
| Measurement | Immigrants from Canada | Colombian |
| Minimum | 35.8% | 50.5% |
| Maximum | 100.0% | 100.0% |
| Range | 64.2% | 49.5% |
| Mean | 74.5% | 80.6% |
| Median | 75.3% | 80.7% |
| Interquartile 25% (IQ1) | 68.7% | 79.2% |
| Interquartile 75% (IQ3) | 78.6% | 82.0% |
| Interquartile Range (IQR) | 9.9% | 2.8% |
| Standard Deviation (Sample) | 12.3% | 5.7% |
| Standard Deviation (Population) | 12.2% | 5.6% |
Similar Demographics by In Labor Force | Age 20-64
Demographics Similar to Immigrants from Canada by In Labor Force | Age 20-64
In terms of in labor force | age 20-64, the demographic groups most similar to Immigrants from Canada are Tlingit-Haida (79.0%, a difference of 0.0%), Samoan (79.0%, a difference of 0.020%), Immigrants from North America (79.0%, a difference of 0.020%), Japanese (79.1%, a difference of 0.040%), and Immigrants from Jamaica (79.0%, a difference of 0.050%).
| Demographics | Rating | Rank | In Labor Force | Age 20-64 |
| Immigrants | Western Europe | 5.9 /100 | #227 | Tragic 79.1% |
| Panamanians | 5.7 /100 | #228 | Tragic 79.1% |
| Alsatians | 5.7 /100 | #229 | Tragic 79.1% |
| Native Hawaiians | 5.6 /100 | #230 | Tragic 79.1% |
| Lebanese | 5.1 /100 | #231 | Tragic 79.1% |
| Guamanians/Chamorros | 4.5 /100 | #232 | Tragic 79.1% |
| Japanese | 4.0 /100 | #233 | Tragic 79.1% |
| Immigrants | Canada | 3.2 /100 | #234 | Tragic 79.0% |
| Tlingit-Haida | 3.2 /100 | #235 | Tragic 79.0% |
| Samoans | 2.9 /100 | #236 | Tragic 79.0% |
| Immigrants | North America | 2.9 /100 | #237 | Tragic 79.0% |
| Immigrants | Jamaica | 2.6 /100 | #238 | Tragic 79.0% |
| Welsh | 2.4 /100 | #239 | Tragic 79.0% |
| Trinidadians and Tobagonians | 2.3 /100 | #240 | Tragic 79.0% |
| Jamaicans | 2.0 /100 | #241 | Tragic 78.9% |
Demographics Similar to Colombians by In Labor Force | Age 20-64
In terms of in labor force | age 20-64, the demographic groups most similar to Colombians are German Russian (80.1%, a difference of 0.0%), Immigrants from Japan (80.1%, a difference of 0.0%), Immigrants from Latvia (80.1%, a difference of 0.0%), Jordanian (80.1%, a difference of 0.010%), and Immigrants from Egypt (80.1%, a difference of 0.010%).
| Demographics | Rating | Rank | In Labor Force | Age 20-64 |
| Egyptians | 97.8 /100 | #76 | Exceptional 80.2% |
| Immigrants | Colombia | 97.8 /100 | #77 | Exceptional 80.2% |
| Immigrants | Romania | 97.8 /100 | #78 | Exceptional 80.2% |
| Asians | 97.7 /100 | #79 | Exceptional 80.2% |
| Immigrants | Croatia | 97.6 /100 | #80 | Exceptional 80.1% |
| German Russians | 97.3 /100 | #81 | Exceptional 80.1% |
| Immigrants | Japan | 97.3 /100 | #82 | Exceptional 80.1% |
| Colombians | 97.3 /100 | #83 | Exceptional 80.1% |
| Immigrants | Latvia | 97.2 /100 | #84 | Exceptional 80.1% |
| Jordanians | 97.2 /100 | #85 | Exceptional 80.1% |
| Immigrants | Egypt | 97.1 /100 | #86 | Exceptional 80.1% |
| Croatians | 97.1 /100 | #87 | Exceptional 80.1% |
| Chileans | 97.0 /100 | #88 | Exceptional 80.1% |
| Immigrants | Venezuela | 96.8 /100 | #89 | Exceptional 80.1% |
| Poles | 96.8 /100 | #90 | Exceptional 80.1% |