Belizean vs Brazilian In Labor Force | Age 20-64
COMPARE
Belizean
Brazilian
In Labor Force | Age 20-64
In Labor Force | Age 20-64 Comparison
Belizeans
Brazilians
78.2%
IN LABOR FORCE | AGE 20-64
0.0/ 100
METRIC RATING
279th/ 347
METRIC RANK
80.5%
IN LABOR FORCE | AGE 20-64
99.8/ 100
METRIC RATING
39th/ 347
METRIC RANK
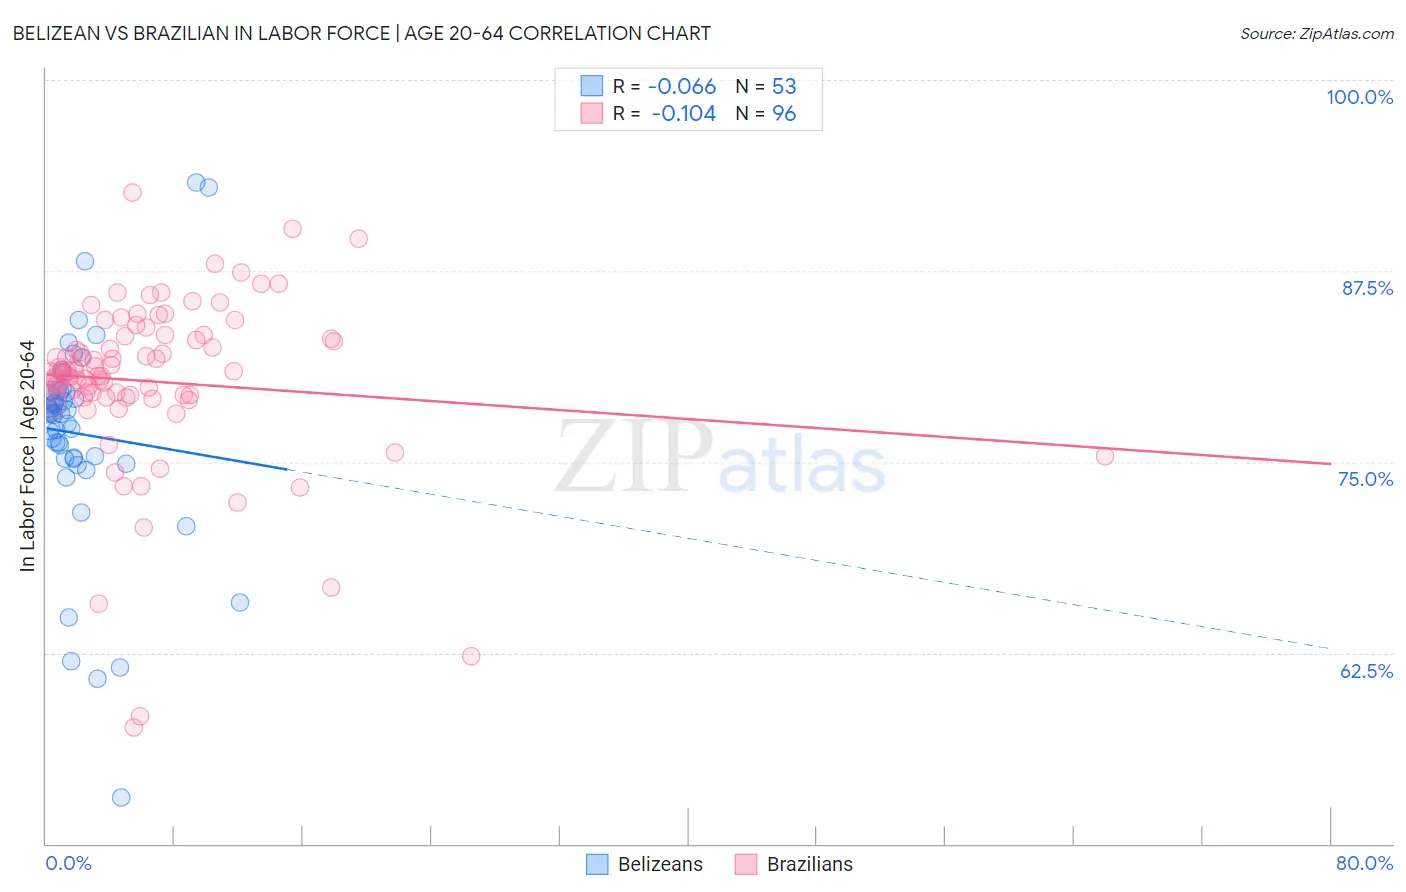
Belizean vs Brazilian In Labor Force | Age 20-64 Correlation Chart
The statistical analysis conducted on geographies consisting of 144,213,246 people shows a slight negative correlation between the proportion of Belizeans and labor force participation rate among population between the ages 20 and 64 in the United States with a correlation coefficient (R) of -0.066 and weighted average of 78.2%. Similarly, the statistical analysis conducted on geographies consisting of 323,965,381 people shows a poor negative correlation between the proportion of Brazilians and labor force participation rate among population between the ages 20 and 64 in the United States with a correlation coefficient (R) of -0.104 and weighted average of 80.5%, a difference of 3.1%.
In Labor Force | Age 20-64 Correlation Summary
| Measurement | Belizean | Brazilian |
| Minimum | 53.0% | 57.6% |
| Maximum | 93.3% | 92.6% |
| Range | 40.3% | 35.0% |
| Mean | 76.8% | 80.3% |
| Median | 78.2% | 80.8% |
| Interquartile 25% (IQ1) | 75.2% | 79.3% |
| Interquartile 75% (IQ3) | 79.7% | 83.2% |
| Interquartile Range (IQR) | 4.5% | 3.8% |
| Standard Deviation (Sample) | 7.1% | 5.7% |
| Standard Deviation (Population) | 7.0% | 5.7% |
Similar Demographics by In Labor Force | Age 20-64
Demographics Similar to Belizeans by In Labor Force | Age 20-64
In terms of in labor force | age 20-64, the demographic groups most similar to Belizeans are Immigrants from Dominica (78.1%, a difference of 0.040%), Mexican American Indian (78.2%, a difference of 0.050%), Immigrants from Bahamas (78.2%, a difference of 0.060%), Spanish (78.2%, a difference of 0.070%), and Puget Sound Salish (78.2%, a difference of 0.070%).
| Demographics | Rating | Rank | In Labor Force | Age 20-64 |
| Marshallese | 0.0 /100 | #272 | Tragic 78.3% |
| French American Indians | 0.0 /100 | #273 | Tragic 78.2% |
| Aleuts | 0.0 /100 | #274 | Tragic 78.2% |
| Spanish | 0.0 /100 | #275 | Tragic 78.2% |
| Puget Sound Salish | 0.0 /100 | #276 | Tragic 78.2% |
| Immigrants | Bahamas | 0.0 /100 | #277 | Tragic 78.2% |
| Mexican American Indians | 0.0 /100 | #278 | Tragic 78.2% |
| Belizeans | 0.0 /100 | #279 | Tragic 78.2% |
| Immigrants | Dominica | 0.0 /100 | #280 | Tragic 78.1% |
| Guyanese | 0.0 /100 | #281 | Tragic 78.1% |
| Immigrants | St. Vincent and the Grenadines | 0.0 /100 | #282 | Tragic 78.1% |
| Immigrants | Nonimmigrants | 0.0 /100 | #283 | Tragic 78.1% |
| Immigrants | Guyana | 0.0 /100 | #284 | Tragic 78.1% |
| Osage | 0.0 /100 | #285 | Tragic 78.0% |
| Immigrants | Belize | 0.0 /100 | #286 | Tragic 78.0% |
Demographics Similar to Brazilians by In Labor Force | Age 20-64
In terms of in labor force | age 20-64, the demographic groups most similar to Brazilians are Immigrants from Zimbabwe (80.5%, a difference of 0.0%), Ugandan (80.6%, a difference of 0.010%), Immigrants from Liberia (80.5%, a difference of 0.020%), Paraguayan (80.6%, a difference of 0.030%), and Immigrants from Moldova (80.6%, a difference of 0.030%).
| Demographics | Rating | Rank | In Labor Force | Age 20-64 |
| Immigrants | Ireland | 99.9 /100 | #32 | Exceptional 80.7% |
| Chinese | 99.9 /100 | #33 | Exceptional 80.7% |
| Immigrants | Brazil | 99.9 /100 | #34 | Exceptional 80.7% |
| Immigrants | Poland | 99.9 /100 | #35 | Exceptional 80.6% |
| Paraguayans | 99.8 /100 | #36 | Exceptional 80.6% |
| Immigrants | Moldova | 99.8 /100 | #37 | Exceptional 80.6% |
| Ugandans | 99.8 /100 | #38 | Exceptional 80.6% |
| Brazilians | 99.8 /100 | #39 | Exceptional 80.5% |
| Immigrants | Zimbabwe | 99.8 /100 | #40 | Exceptional 80.5% |
| Immigrants | Liberia | 99.8 /100 | #41 | Exceptional 80.5% |
| Latvians | 99.8 /100 | #42 | Exceptional 80.5% |
| Czechs | 99.7 /100 | #43 | Exceptional 80.5% |
| Immigrants | Middle Africa | 99.7 /100 | #44 | Exceptional 80.5% |
| Slovenes | 99.7 /100 | #45 | Exceptional 80.5% |
| Immigrants | Pakistan | 99.6 /100 | #46 | Exceptional 80.5% |