Ghanaian vs Asian In Labor Force | Age 25-29
COMPARE
Ghanaian
Asian
In Labor Force | Age 25-29
In Labor Force | Age 25-29 Comparison
Ghanaians
Asians
84.7%
IN LABOR FORCE | AGE 25-29
57.6/ 100
METRIC RATING
164th/ 347
METRIC RANK
84.8%
IN LABOR FORCE | AGE 25-29
77.7/ 100
METRIC RATING
133rd/ 347
METRIC RANK
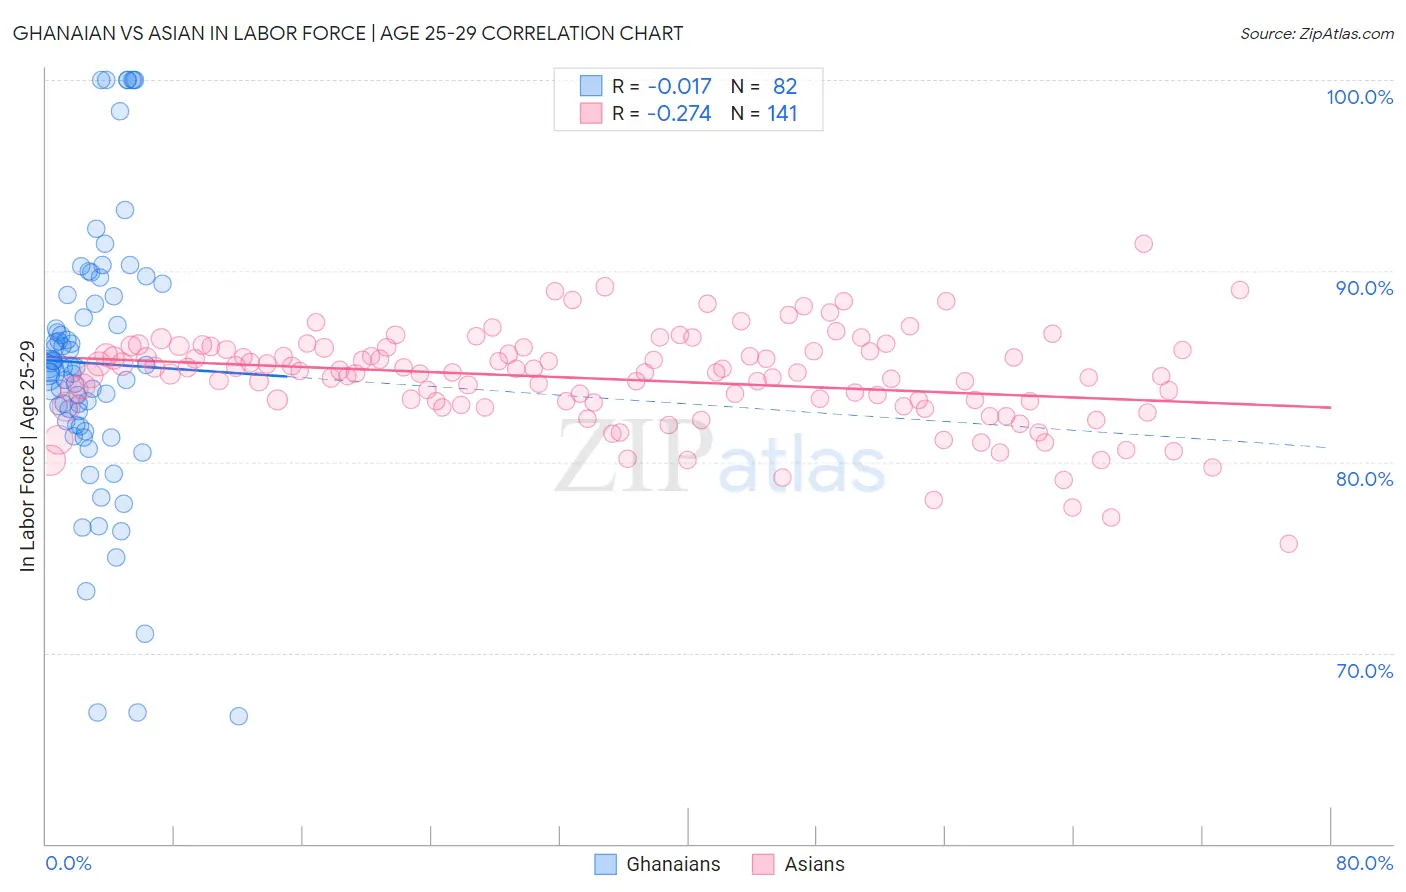
Ghanaian vs Asian In Labor Force | Age 25-29 Correlation Chart
The statistical analysis conducted on geographies consisting of 190,676,987 people shows no correlation between the proportion of Ghanaians and labor force participation rate among population between the ages 25 and 29 in the United States with a correlation coefficient (R) of -0.017 and weighted average of 84.7%. Similarly, the statistical analysis conducted on geographies consisting of 550,144,058 people shows a weak negative correlation between the proportion of Asians and labor force participation rate among population between the ages 25 and 29 in the United States with a correlation coefficient (R) of -0.274 and weighted average of 84.8%, a difference of 0.17%.
In Labor Force | Age 25-29 Correlation Summary
| Measurement | Ghanaian | Asian |
| Minimum | 66.7% | 75.7% |
| Maximum | 100.0% | 91.4% |
| Range | 33.3% | 15.7% |
| Mean | 85.2% | 84.3% |
| Median | 84.9% | 84.7% |
| Interquartile 25% (IQ1) | 81.9% | 83.0% |
| Interquartile 75% (IQ3) | 88.7% | 85.9% |
| Interquartile Range (IQR) | 6.8% | 2.8% |
| Standard Deviation (Sample) | 7.1% | 2.5% |
| Standard Deviation (Population) | 7.1% | 2.5% |
Similar Demographics by In Labor Force | Age 25-29
Demographics Similar to Ghanaians by In Labor Force | Age 25-29
In terms of in labor force | age 25-29, the demographic groups most similar to Ghanaians are Immigrants from Colombia (84.7%, a difference of 0.0%), Argentinean (84.7%, a difference of 0.0%), Immigrants from Burma/Myanmar (84.7%, a difference of 0.0%), Immigrants from Peru (84.7%, a difference of 0.010%), and Canadian (84.7%, a difference of 0.010%).
| Demographics | Rating | Rank | In Labor Force | Age 25-29 |
| British | 60.4 /100 | #157 | Good 84.7% |
| Immigrants | Ghana | 60.2 /100 | #158 | Good 84.7% |
| Immigrants | Western Africa | 60.1 /100 | #159 | Good 84.7% |
| Immigrants | Peru | 58.6 /100 | #160 | Average 84.7% |
| Canadians | 58.5 /100 | #161 | Average 84.7% |
| Immigrants | Colombia | 58.3 /100 | #162 | Average 84.7% |
| Argentineans | 57.9 /100 | #163 | Average 84.7% |
| Ghanaians | 57.6 /100 | #164 | Average 84.7% |
| Immigrants | Burma/Myanmar | 57.4 /100 | #165 | Average 84.7% |
| Immigrants | Spain | 56.9 /100 | #166 | Average 84.7% |
| Indonesians | 56.5 /100 | #167 | Average 84.7% |
| South Americans | 54.9 /100 | #168 | Average 84.7% |
| Celtics | 52.5 /100 | #169 | Average 84.7% |
| Tongans | 52.4 /100 | #170 | Average 84.7% |
| Immigrants | Vietnam | 50.5 /100 | #171 | Average 84.7% |
Demographics Similar to Asians by In Labor Force | Age 25-29
In terms of in labor force | age 25-29, the demographic groups most similar to Asians are Iranian (84.8%, a difference of 0.0%), Romanian (84.8%, a difference of 0.0%), Syrian (84.8%, a difference of 0.010%), Immigrants from Hungary (84.8%, a difference of 0.010%), and Bhutanese (84.8%, a difference of 0.020%).
| Demographics | Rating | Rank | In Labor Force | Age 25-29 |
| Immigrants | Singapore | 84.4 /100 | #126 | Excellent 84.9% |
| Immigrants | Uruguay | 84.0 /100 | #127 | Excellent 84.9% |
| Australians | 83.6 /100 | #128 | Excellent 84.9% |
| Immigrants | Russia | 81.6 /100 | #129 | Excellent 84.9% |
| Northern Europeans | 81.3 /100 | #130 | Excellent 84.9% |
| Iranians | 78.1 /100 | #131 | Good 84.8% |
| Romanians | 77.7 /100 | #132 | Good 84.8% |
| Asians | 77.7 /100 | #133 | Good 84.8% |
| Syrians | 76.5 /100 | #134 | Good 84.8% |
| Immigrants | Hungary | 76.4 /100 | #135 | Good 84.8% |
| Bhutanese | 76.0 /100 | #136 | Good 84.8% |
| Immigrants | Canada | 73.5 /100 | #137 | Good 84.8% |
| Armenians | 72.7 /100 | #138 | Good 84.8% |
| Immigrants | Eastern Asia | 72.6 /100 | #139 | Good 84.8% |
| Immigrants | North America | 72.1 /100 | #140 | Good 84.8% |