Serbian vs Asian In Labor Force | Age 25-29
COMPARE
Serbian
Asian
In Labor Force | Age 25-29
In Labor Force | Age 25-29 Comparison
Serbians
Asians
85.5%
IN LABOR FORCE | AGE 25-29
99.5/ 100
METRIC RATING
61st/ 347
METRIC RANK
84.8%
IN LABOR FORCE | AGE 25-29
77.7/ 100
METRIC RATING
133rd/ 347
METRIC RANK
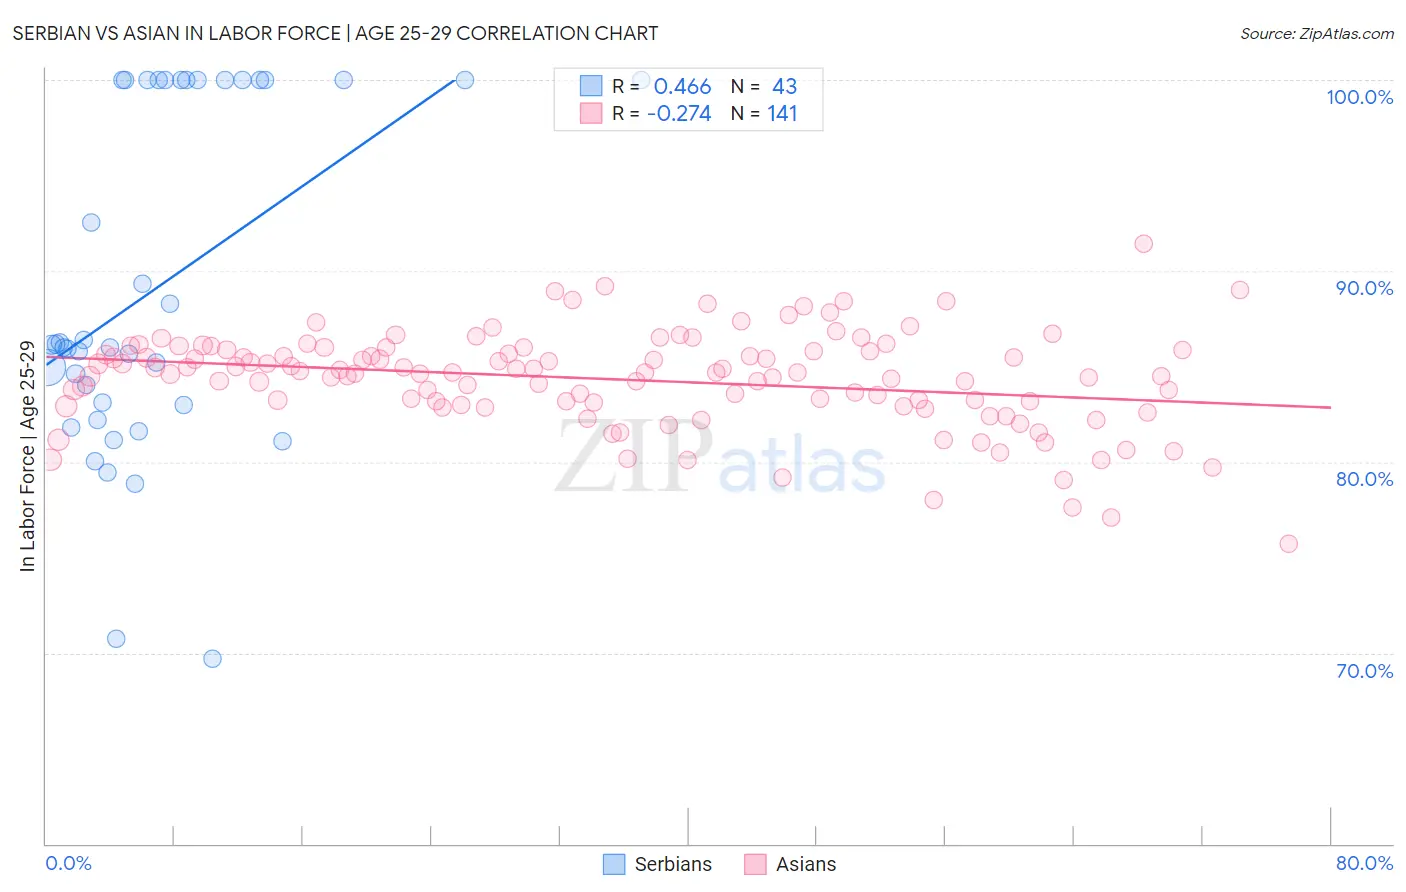
Serbian vs Asian In Labor Force | Age 25-29 Correlation Chart
The statistical analysis conducted on geographies consisting of 267,583,292 people shows a moderate positive correlation between the proportion of Serbians and labor force participation rate among population between the ages 25 and 29 in the United States with a correlation coefficient (R) of 0.466 and weighted average of 85.5%. Similarly, the statistical analysis conducted on geographies consisting of 550,144,058 people shows a weak negative correlation between the proportion of Asians and labor force participation rate among population between the ages 25 and 29 in the United States with a correlation coefficient (R) of -0.274 and weighted average of 84.8%, a difference of 0.73%.
In Labor Force | Age 25-29 Correlation Summary
| Measurement | Serbian | Asian |
| Minimum | 69.7% | 75.7% |
| Maximum | 100.0% | 91.4% |
| Range | 30.3% | 15.7% |
| Mean | 89.2% | 84.3% |
| Median | 86.2% | 84.7% |
| Interquartile 25% (IQ1) | 83.0% | 83.0% |
| Interquartile 75% (IQ3) | 100.0% | 85.9% |
| Interquartile Range (IQR) | 17.0% | 2.8% |
| Standard Deviation (Sample) | 8.9% | 2.5% |
| Standard Deviation (Population) | 8.8% | 2.5% |
Similar Demographics by In Labor Force | Age 25-29
Demographics Similar to Serbians by In Labor Force | Age 25-29
In terms of in labor force | age 25-29, the demographic groups most similar to Serbians are Thai (85.5%, a difference of 0.0%), Taiwanese (85.4%, a difference of 0.020%), Immigrants from Kenya (85.4%, a difference of 0.020%), Immigrants from Morocco (85.5%, a difference of 0.030%), and Estonian (85.5%, a difference of 0.040%).
| Demographics | Rating | Rank | In Labor Force | Age 25-29 |
| Albanians | 99.7 /100 | #54 | Exceptional 85.5% |
| Immigrants | Brazil | 99.7 /100 | #55 | Exceptional 85.5% |
| Eastern Europeans | 99.6 /100 | #56 | Exceptional 85.5% |
| Estonians | 99.6 /100 | #57 | Exceptional 85.5% |
| Greeks | 99.6 /100 | #58 | Exceptional 85.5% |
| Immigrants | Morocco | 99.5 /100 | #59 | Exceptional 85.5% |
| Thais | 99.5 /100 | #60 | Exceptional 85.5% |
| Serbians | 99.5 /100 | #61 | Exceptional 85.5% |
| Taiwanese | 99.4 /100 | #62 | Exceptional 85.4% |
| Immigrants | Kenya | 99.4 /100 | #63 | Exceptional 85.4% |
| Immigrants | Italy | 99.3 /100 | #64 | Exceptional 85.4% |
| Immigrants | Czechoslovakia | 99.3 /100 | #65 | Exceptional 85.4% |
| Immigrants | Scotland | 99.3 /100 | #66 | Exceptional 85.4% |
| Immigrants | Turkey | 99.2 /100 | #67 | Exceptional 85.4% |
| Immigrants | Cameroon | 99.2 /100 | #68 | Exceptional 85.4% |
Demographics Similar to Asians by In Labor Force | Age 25-29
In terms of in labor force | age 25-29, the demographic groups most similar to Asians are Iranian (84.8%, a difference of 0.0%), Romanian (84.8%, a difference of 0.0%), Syrian (84.8%, a difference of 0.010%), Immigrants from Hungary (84.8%, a difference of 0.010%), and Bhutanese (84.8%, a difference of 0.020%).
| Demographics | Rating | Rank | In Labor Force | Age 25-29 |
| Immigrants | Singapore | 84.4 /100 | #126 | Excellent 84.9% |
| Immigrants | Uruguay | 84.0 /100 | #127 | Excellent 84.9% |
| Australians | 83.6 /100 | #128 | Excellent 84.9% |
| Immigrants | Russia | 81.6 /100 | #129 | Excellent 84.9% |
| Northern Europeans | 81.3 /100 | #130 | Excellent 84.9% |
| Iranians | 78.1 /100 | #131 | Good 84.8% |
| Romanians | 77.7 /100 | #132 | Good 84.8% |
| Asians | 77.7 /100 | #133 | Good 84.8% |
| Syrians | 76.5 /100 | #134 | Good 84.8% |
| Immigrants | Hungary | 76.4 /100 | #135 | Good 84.8% |
| Bhutanese | 76.0 /100 | #136 | Good 84.8% |
| Immigrants | Canada | 73.5 /100 | #137 | Good 84.8% |
| Armenians | 72.7 /100 | #138 | Good 84.8% |
| Immigrants | Eastern Asia | 72.6 /100 | #139 | Good 84.8% |
| Immigrants | North America | 72.1 /100 | #140 | Good 84.8% |