Immigrants from Barbados vs Alsatian In Labor Force | Age 25-29
COMPARE
Immigrants from Barbados
Alsatian
In Labor Force | Age 25-29
In Labor Force | Age 25-29 Comparison
Immigrants from Barbados
Alsatians
83.4%
IN LABOR FORCE | AGE 25-29
0.0/ 100
METRIC RATING
269th/ 347
METRIC RANK
83.9%
IN LABOR FORCE | AGE 25-29
0.7/ 100
METRIC RATING
241st/ 347
METRIC RANK
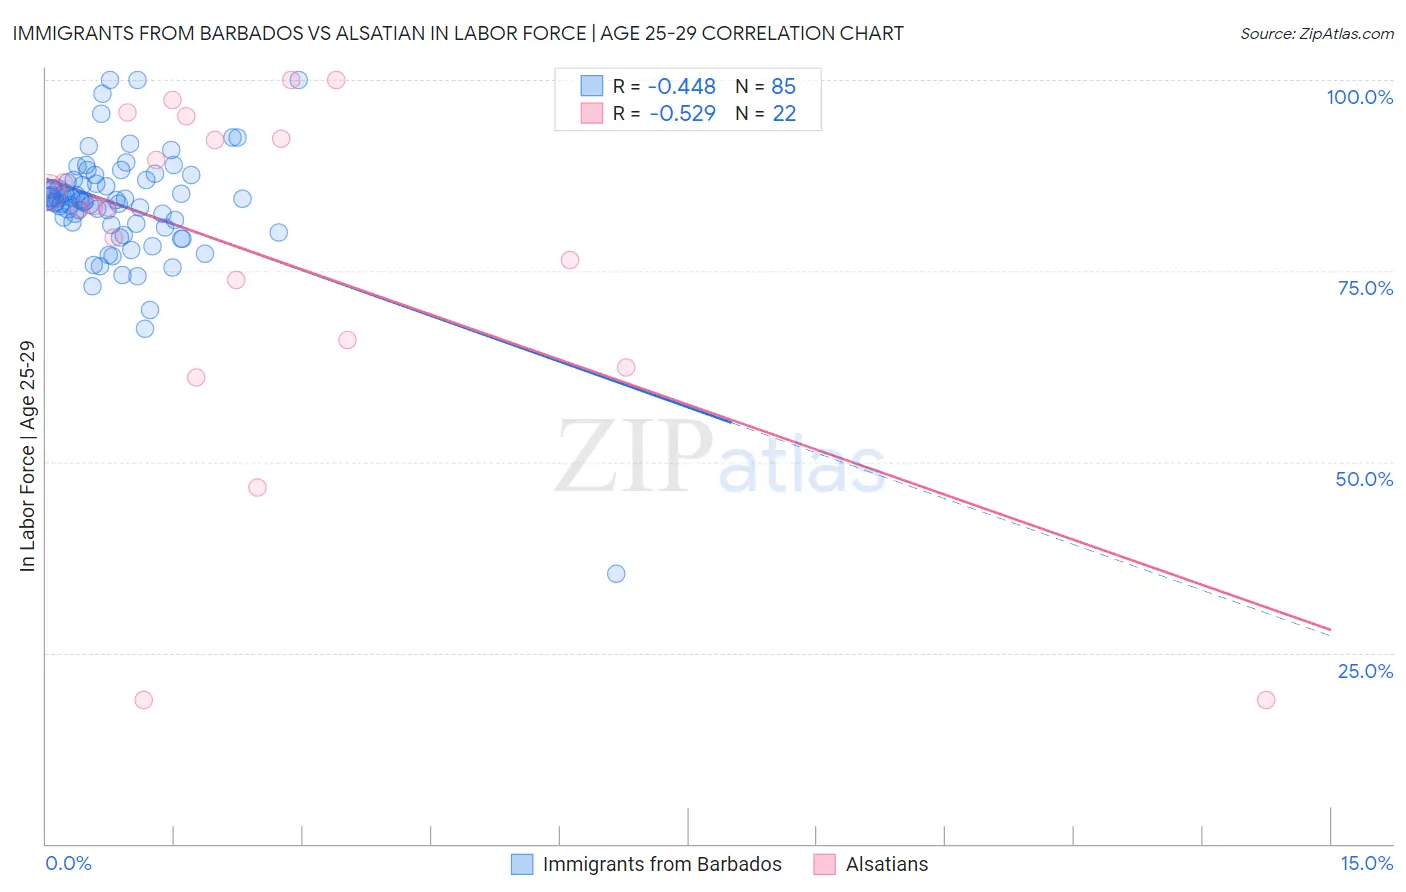
Immigrants from Barbados vs Alsatian In Labor Force | Age 25-29 Correlation Chart
The statistical analysis conducted on geographies consisting of 112,776,614 people shows a moderate negative correlation between the proportion of Immigrants from Barbados and labor force participation rate among population between the ages 25 and 29 in the United States with a correlation coefficient (R) of -0.448 and weighted average of 83.4%. Similarly, the statistical analysis conducted on geographies consisting of 82,674,236 people shows a substantial negative correlation between the proportion of Alsatians and labor force participation rate among population between the ages 25 and 29 in the United States with a correlation coefficient (R) of -0.529 and weighted average of 83.9%, a difference of 0.54%.
In Labor Force | Age 25-29 Correlation Summary
| Measurement | Immigrants from Barbados | Alsatian |
| Minimum | 35.4% | 18.8% |
| Maximum | 100.0% | 100.0% |
| Range | 64.6% | 81.2% |
| Mean | 83.6% | 76.7% |
| Median | 84.2% | 83.4% |
| Interquartile 25% (IQ1) | 81.1% | 66.0% |
| Interquartile 75% (IQ3) | 86.8% | 92.3% |
| Interquartile Range (IQR) | 5.7% | 26.3% |
| Standard Deviation (Sample) | 8.0% | 23.2% |
| Standard Deviation (Population) | 7.9% | 22.7% |
Similar Demographics by In Labor Force | Age 25-29
Demographics Similar to Immigrants from Barbados by In Labor Force | Age 25-29
In terms of in labor force | age 25-29, the demographic groups most similar to Immigrants from Barbados are Immigrants from Lebanon (83.4%, a difference of 0.0%), Spanish American (83.4%, a difference of 0.010%), Basque (83.4%, a difference of 0.010%), Aleut (83.4%, a difference of 0.020%), and Honduran (83.4%, a difference of 0.040%).
| Demographics | Rating | Rank | In Labor Force | Age 25-29 |
| Immigrants | Fiji | 0.1 /100 | #262 | Tragic 83.6% |
| West Indians | 0.1 /100 | #263 | Tragic 83.5% |
| Puget Sound Salish | 0.1 /100 | #264 | Tragic 83.5% |
| Cubans | 0.1 /100 | #265 | Tragic 83.5% |
| Aleuts | 0.0 /100 | #266 | Tragic 83.4% |
| Spanish Americans | 0.0 /100 | #267 | Tragic 83.4% |
| Immigrants | Lebanon | 0.0 /100 | #268 | Tragic 83.4% |
| Immigrants | Barbados | 0.0 /100 | #269 | Tragic 83.4% |
| Basques | 0.0 /100 | #270 | Tragic 83.4% |
| Hondurans | 0.0 /100 | #271 | Tragic 83.4% |
| Immigrants | Caribbean | 0.0 /100 | #272 | Tragic 83.4% |
| Immigrants | Dominica | 0.0 /100 | #273 | Tragic 83.4% |
| Marshallese | 0.0 /100 | #274 | Tragic 83.3% |
| Samoans | 0.0 /100 | #275 | Tragic 83.3% |
| Immigrants | Honduras | 0.0 /100 | #276 | Tragic 83.3% |
Demographics Similar to Alsatians by In Labor Force | Age 25-29
In terms of in labor force | age 25-29, the demographic groups most similar to Alsatians are Trinidadian and Tobagonian (83.9%, a difference of 0.020%), Immigrants from Uzbekistan (83.9%, a difference of 0.030%), Jamaican (83.9%, a difference of 0.030%), U.S. Virgin Islander (83.8%, a difference of 0.030%), and Salvadoran (83.8%, a difference of 0.040%).
| Demographics | Rating | Rank | In Labor Force | Age 25-29 |
| Barbadians | 1.0 /100 | #234 | Tragic 83.9% |
| Iraqis | 0.9 /100 | #235 | Tragic 83.9% |
| Guamanians/Chamorros | 0.9 /100 | #236 | Tragic 83.9% |
| Immigrants | Immigrants | 0.9 /100 | #237 | Tragic 83.9% |
| Immigrants | Uzbekistan | 0.8 /100 | #238 | Tragic 83.9% |
| Jamaicans | 0.8 /100 | #239 | Tragic 83.9% |
| Trinidadians and Tobagonians | 0.7 /100 | #240 | Tragic 83.9% |
| Alsatians | 0.7 /100 | #241 | Tragic 83.9% |
| U.S. Virgin Islanders | 0.6 /100 | #242 | Tragic 83.8% |
| Salvadorans | 0.5 /100 | #243 | Tragic 83.8% |
| Immigrants | Jamaica | 0.4 /100 | #244 | Tragic 83.8% |
| Iroquois | 0.4 /100 | #245 | Tragic 83.8% |
| Cree | 0.3 /100 | #246 | Tragic 83.8% |
| Immigrants | El Salvador | 0.3 /100 | #247 | Tragic 83.7% |
| Immigrants | Nonimmigrants | 0.3 /100 | #248 | Tragic 83.7% |