Immigrants from India vs Alsatian Single Father Households
COMPARE
Immigrants from India
Alsatian
Single Father Households
Single Father Households Comparison
Immigrants from India
Alsatians
1.9%
SINGLE FATHER HOUSEHOLDS
100.0/ 100
METRIC RATING
17th/ 347
METRIC RANK
2.1%
SINGLE FATHER HOUSEHOLDS
98.9/ 100
METRIC RATING
104th/ 347
METRIC RANK
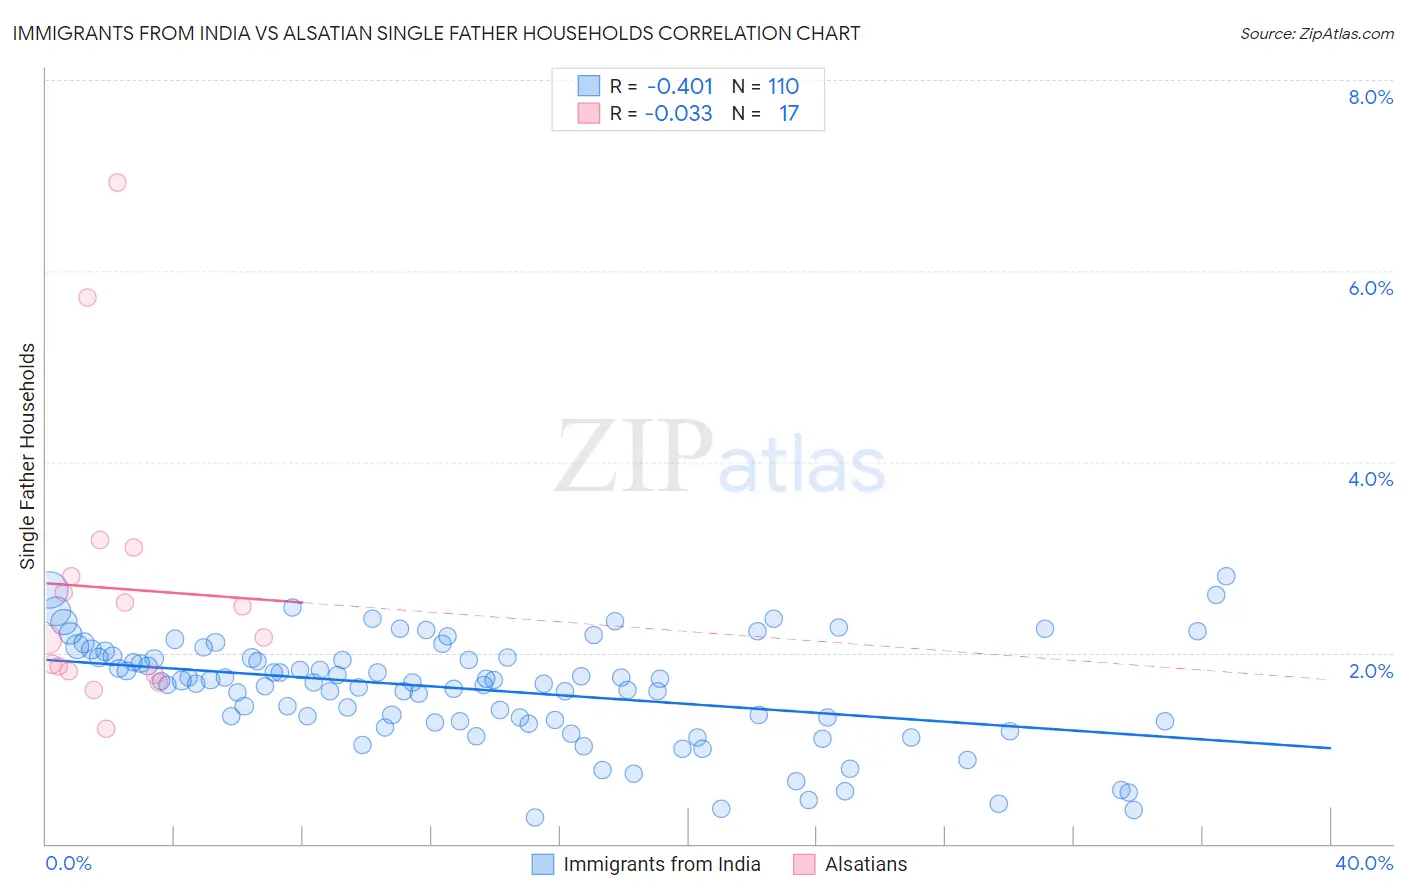
Immigrants from India vs Alsatian Single Father Households Correlation Chart
The statistical analysis conducted on geographies consisting of 429,563,662 people shows a moderate negative correlation between the proportion of Immigrants from India and percentage of single father households in the United States with a correlation coefficient (R) of -0.401 and weighted average of 1.9%. Similarly, the statistical analysis conducted on geographies consisting of 82,369,441 people shows no correlation between the proportion of Alsatians and percentage of single father households in the United States with a correlation coefficient (R) of -0.033 and weighted average of 2.1%, a difference of 13.1%.
Single Father Households Correlation Summary
| Measurement | Immigrants from India | Alsatian |
| Minimum | 0.27% | 1.2% |
| Maximum | 2.8% | 6.9% |
| Range | 2.5% | 5.7% |
| Mean | 1.6% | 2.7% |
| Median | 1.7% | 2.2% |
| Interquartile 25% (IQ1) | 1.3% | 1.8% |
| Interquartile 75% (IQ3) | 2.0% | 3.0% |
| Interquartile Range (IQR) | 0.67% | 1.2% |
| Standard Deviation (Sample) | 0.55% | 1.5% |
| Standard Deviation (Population) | 0.54% | 1.4% |
Similar Demographics by Single Father Households
Demographics Similar to Immigrants from India by Single Father Households
In terms of single father households, the demographic groups most similar to Immigrants from India are Immigrants from Iran (1.9%, a difference of 0.23%), Immigrants from Eastern Asia (1.9%, a difference of 0.43%), Indian (Asian) (1.9%, a difference of 0.50%), Immigrants from Lithuania (1.9%, a difference of 0.58%), and Iranian (1.9%, a difference of 1.3%).
| Demographics | Rating | Rank | Single Father Households |
| Okinawans | 100.0 /100 | #10 | Exceptional 1.9% |
| Immigrants | Belarus | 100.0 /100 | #11 | Exceptional 1.9% |
| Immigrants | Greece | 100.0 /100 | #12 | Exceptional 1.9% |
| Immigrants | Singapore | 100.0 /100 | #13 | Exceptional 1.9% |
| Immigrants | Lithuania | 100.0 /100 | #14 | Exceptional 1.9% |
| Immigrants | Eastern Asia | 100.0 /100 | #15 | Exceptional 1.9% |
| Immigrants | Iran | 100.0 /100 | #16 | Exceptional 1.9% |
| Immigrants | India | 100.0 /100 | #17 | Exceptional 1.9% |
| Indians (Asian) | 100.0 /100 | #18 | Exceptional 1.9% |
| Iranians | 100.0 /100 | #19 | Exceptional 1.9% |
| Thais | 100.0 /100 | #20 | Exceptional 1.9% |
| Immigrants | Albania | 100.0 /100 | #21 | Exceptional 1.9% |
| Immigrants | Latvia | 100.0 /100 | #22 | Exceptional 1.9% |
| Immigrants | Croatia | 100.0 /100 | #23 | Exceptional 2.0% |
| Immigrants | Russia | 100.0 /100 | #24 | Exceptional 2.0% |
Demographics Similar to Alsatians by Single Father Households
In terms of single father households, the demographic groups most similar to Alsatians are Lebanese (2.1%, a difference of 0.020%), Argentinean (2.1%, a difference of 0.040%), Immigrants from Western Europe (2.1%, a difference of 0.070%), Immigrants from Northern Africa (2.1%, a difference of 0.22%), and South African (2.1%, a difference of 0.37%).
| Demographics | Rating | Rank | Single Father Households |
| Immigrants | Moldova | 99.1 /100 | #97 | Exceptional 2.1% |
| Guyanese | 99.1 /100 | #98 | Exceptional 2.1% |
| South Africans | 99.1 /100 | #99 | Exceptional 2.1% |
| Immigrants | Northern Africa | 99.0 /100 | #100 | Exceptional 2.1% |
| Immigrants | Western Europe | 98.9 /100 | #101 | Exceptional 2.1% |
| Argentineans | 98.9 /100 | #102 | Exceptional 2.1% |
| Lebanese | 98.9 /100 | #103 | Exceptional 2.1% |
| Alsatians | 98.9 /100 | #104 | Exceptional 2.1% |
| Palestinians | 98.6 /100 | #105 | Exceptional 2.2% |
| Immigrants | Southern Europe | 98.6 /100 | #106 | Exceptional 2.2% |
| Slovenes | 98.5 /100 | #107 | Exceptional 2.2% |
| Immigrants | Netherlands | 98.5 /100 | #108 | Exceptional 2.2% |
| Barbadians | 98.4 /100 | #109 | Exceptional 2.2% |
| Italians | 98.3 /100 | #110 | Exceptional 2.2% |
| Immigrants | Canada | 98.3 /100 | #111 | Exceptional 2.2% |