Immigrants from Argentina vs Alsatian In Labor Force | Age 25-29
COMPARE
Immigrants from Argentina
Alsatian
In Labor Force | Age 25-29
In Labor Force | Age 25-29 Comparison
Immigrants from Argentina
Alsatians
84.6%
IN LABOR FORCE | AGE 25-29
44.0/ 100
METRIC RATING
179th/ 347
METRIC RANK
83.9%
IN LABOR FORCE | AGE 25-29
0.7/ 100
METRIC RATING
241st/ 347
METRIC RANK
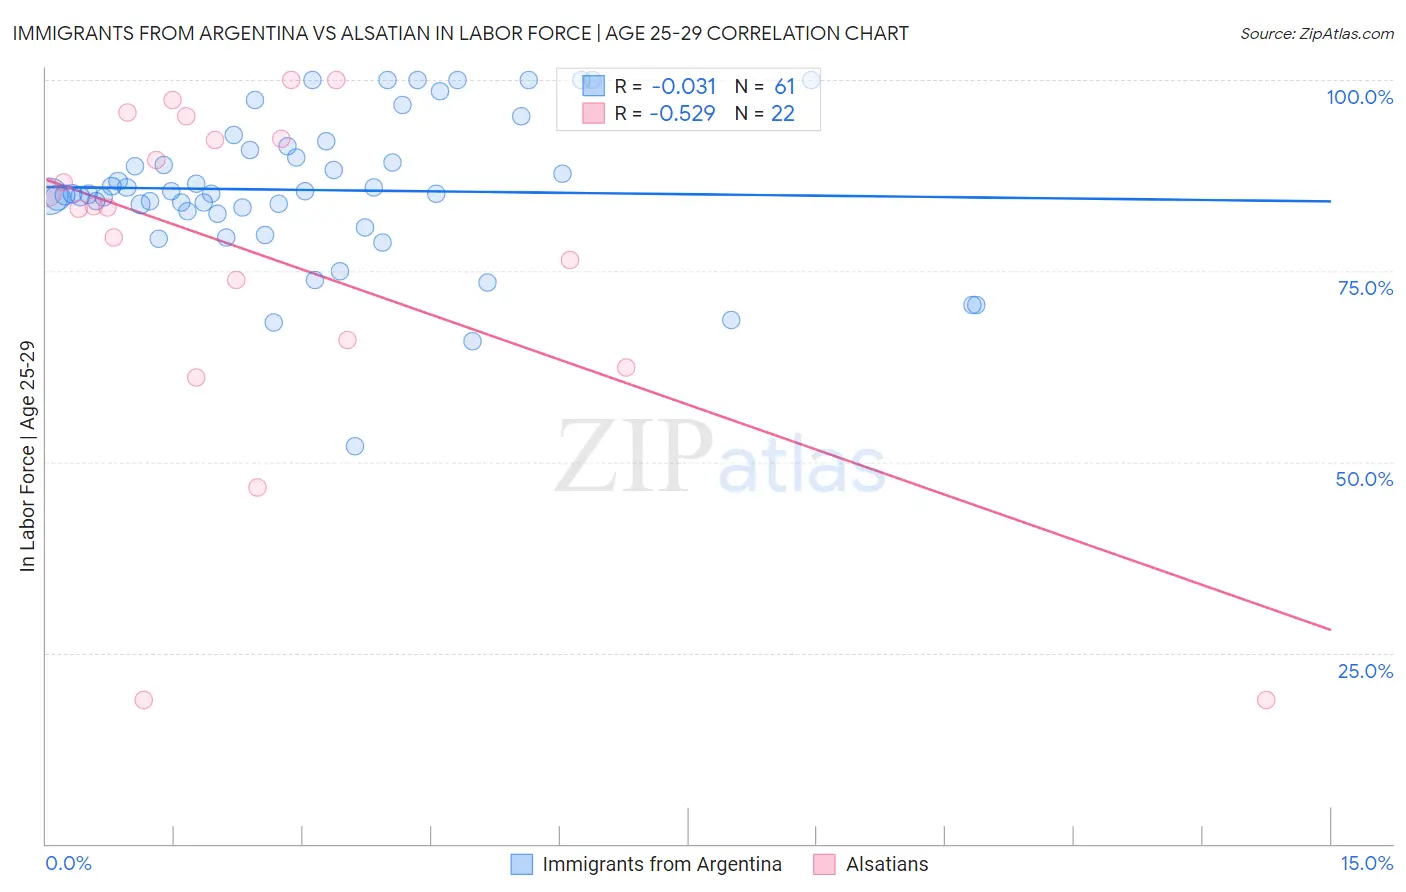
Immigrants from Argentina vs Alsatian In Labor Force | Age 25-29 Correlation Chart
The statistical analysis conducted on geographies consisting of 264,395,747 people shows no correlation between the proportion of Immigrants from Argentina and labor force participation rate among population between the ages 25 and 29 in the United States with a correlation coefficient (R) of -0.031 and weighted average of 84.6%. Similarly, the statistical analysis conducted on geographies consisting of 82,674,236 people shows a substantial negative correlation between the proportion of Alsatians and labor force participation rate among population between the ages 25 and 29 in the United States with a correlation coefficient (R) of -0.529 and weighted average of 83.9%, a difference of 0.89%.
In Labor Force | Age 25-29 Correlation Summary
| Measurement | Immigrants from Argentina | Alsatian |
| Minimum | 52.0% | 18.8% |
| Maximum | 100.0% | 100.0% |
| Range | 48.0% | 81.2% |
| Mean | 85.6% | 76.7% |
| Median | 85.1% | 83.4% |
| Interquartile 25% (IQ1) | 82.7% | 66.0% |
| Interquartile 75% (IQ3) | 91.1% | 92.3% |
| Interquartile Range (IQR) | 8.4% | 26.3% |
| Standard Deviation (Sample) | 9.7% | 23.2% |
| Standard Deviation (Population) | 9.6% | 22.7% |
Similar Demographics by In Labor Force | Age 25-29
Demographics Similar to Immigrants from Argentina by In Labor Force | Age 25-29
In terms of in labor force | age 25-29, the demographic groups most similar to Immigrants from Argentina are Immigrants from China (84.6%, a difference of 0.010%), Immigrants from Thailand (84.6%, a difference of 0.010%), Immigrants from South America (84.6%, a difference of 0.010%), Malaysian (84.6%, a difference of 0.020%), and Immigrants from Norway (84.6%, a difference of 0.020%).
| Demographics | Rating | Rank | In Labor Force | Age 25-29 |
| Immigrants | Western Europe | 50.4 /100 | #172 | Average 84.7% |
| Assyrians/Chaldeans/Syriacs | 50.2 /100 | #173 | Average 84.7% |
| Palestinians | 50.0 /100 | #174 | Average 84.7% |
| Hungarians | 47.8 /100 | #175 | Average 84.6% |
| Malaysians | 46.8 /100 | #176 | Average 84.6% |
| Immigrants | China | 45.7 /100 | #177 | Average 84.6% |
| Immigrants | Thailand | 45.2 /100 | #178 | Average 84.6% |
| Immigrants | Argentina | 44.0 /100 | #179 | Average 84.6% |
| Immigrants | South America | 42.9 /100 | #180 | Average 84.6% |
| Immigrants | Norway | 41.9 /100 | #181 | Average 84.6% |
| Europeans | 40.3 /100 | #182 | Average 84.6% |
| Scottish | 40.1 /100 | #183 | Average 84.6% |
| Immigrants | Kuwait | 38.2 /100 | #184 | Fair 84.6% |
| Immigrants | Denmark | 37.0 /100 | #185 | Fair 84.6% |
| Immigrants | Belgium | 35.0 /100 | #186 | Fair 84.6% |
Demographics Similar to Alsatians by In Labor Force | Age 25-29
In terms of in labor force | age 25-29, the demographic groups most similar to Alsatians are Trinidadian and Tobagonian (83.9%, a difference of 0.020%), Immigrants from Uzbekistan (83.9%, a difference of 0.030%), Jamaican (83.9%, a difference of 0.030%), U.S. Virgin Islander (83.8%, a difference of 0.030%), and Salvadoran (83.8%, a difference of 0.040%).
| Demographics | Rating | Rank | In Labor Force | Age 25-29 |
| Barbadians | 1.0 /100 | #234 | Tragic 83.9% |
| Iraqis | 0.9 /100 | #235 | Tragic 83.9% |
| Guamanians/Chamorros | 0.9 /100 | #236 | Tragic 83.9% |
| Immigrants | Immigrants | 0.9 /100 | #237 | Tragic 83.9% |
| Immigrants | Uzbekistan | 0.8 /100 | #238 | Tragic 83.9% |
| Jamaicans | 0.8 /100 | #239 | Tragic 83.9% |
| Trinidadians and Tobagonians | 0.7 /100 | #240 | Tragic 83.9% |
| Alsatians | 0.7 /100 | #241 | Tragic 83.9% |
| U.S. Virgin Islanders | 0.6 /100 | #242 | Tragic 83.8% |
| Salvadorans | 0.5 /100 | #243 | Tragic 83.8% |
| Immigrants | Jamaica | 0.4 /100 | #244 | Tragic 83.8% |
| Iroquois | 0.4 /100 | #245 | Tragic 83.8% |
| Cree | 0.3 /100 | #246 | Tragic 83.8% |
| Immigrants | El Salvador | 0.3 /100 | #247 | Tragic 83.7% |
| Immigrants | Nonimmigrants | 0.3 /100 | #248 | Tragic 83.7% |