Immigrants from Philippines vs Israeli In Labor Force | Age 20-24
COMPARE
Immigrants from Philippines
Israeli
In Labor Force | Age 20-24
In Labor Force | Age 20-24 Comparison
Immigrants from Philippines
Israelis
75.1%
IN LABOR FORCE | AGE 20-24
55.8/ 100
METRIC RATING
169th/ 347
METRIC RANK
72.6%
IN LABOR FORCE | AGE 20-24
0.0/ 100
METRIC RATING
298th/ 347
METRIC RANK
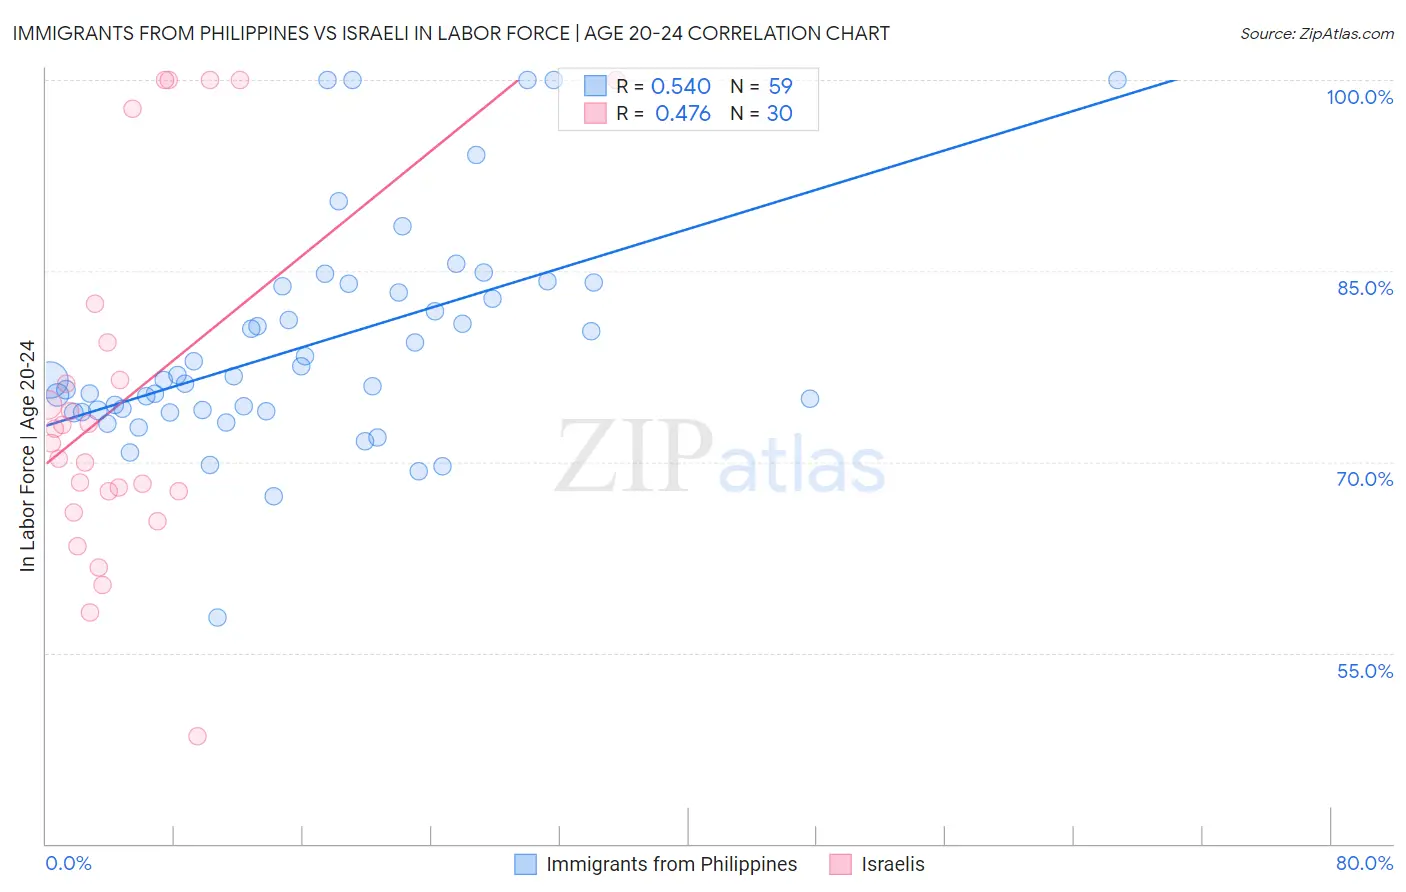
Immigrants from Philippines vs Israeli In Labor Force | Age 20-24 Correlation Chart
The statistical analysis conducted on geographies consisting of 470,994,920 people shows a substantial positive correlation between the proportion of Immigrants from Philippines and labor force participation rate among population between the ages 20 and 24 in the United States with a correlation coefficient (R) of 0.540 and weighted average of 75.1%. Similarly, the statistical analysis conducted on geographies consisting of 211,140,370 people shows a moderate positive correlation between the proportion of Israelis and labor force participation rate among population between the ages 20 and 24 in the United States with a correlation coefficient (R) of 0.476 and weighted average of 72.6%, a difference of 3.5%.
In Labor Force | Age 20-24 Correlation Summary
| Measurement | Immigrants from Philippines | Israeli |
| Minimum | 57.8% | 48.4% |
| Maximum | 100.0% | 100.0% |
| Range | 42.2% | 51.6% |
| Mean | 79.2% | 75.1% |
| Median | 76.5% | 72.0% |
| Interquartile 25% (IQ1) | 74.0% | 67.7% |
| Interquartile 75% (IQ3) | 83.8% | 79.4% |
| Interquartile Range (IQR) | 9.8% | 11.7% |
| Standard Deviation (Sample) | 8.7% | 14.1% |
| Standard Deviation (Population) | 8.6% | 13.8% |
Similar Demographics by In Labor Force | Age 20-24
Demographics Similar to Immigrants from Philippines by In Labor Force | Age 20-24
In terms of in labor force | age 20-24, the demographic groups most similar to Immigrants from Philippines are Immigrants from Western Africa (75.1%, a difference of 0.010%), Immigrants from South Eastern Asia (75.1%, a difference of 0.030%), Mexican (75.1%, a difference of 0.050%), Cambodian (75.2%, a difference of 0.070%), and Cajun (75.1%, a difference of 0.070%).
| Demographics | Rating | Rank | In Labor Force | Age 20-24 |
| Immigrants | Romania | 64.6 /100 | #162 | Good 75.2% |
| Costa Ricans | 64.2 /100 | #163 | Good 75.2% |
| Bolivians | 64.0 /100 | #164 | Good 75.2% |
| Afghans | 63.5 /100 | #165 | Good 75.2% |
| Cambodians | 60.5 /100 | #166 | Good 75.2% |
| Immigrants | South Eastern Asia | 57.5 /100 | #167 | Average 75.1% |
| Immigrants | Western Africa | 56.7 /100 | #168 | Average 75.1% |
| Immigrants | Philippines | 55.8 /100 | #169 | Average 75.1% |
| Mexicans | 52.1 /100 | #170 | Average 75.1% |
| Cajuns | 51.1 /100 | #171 | Average 75.1% |
| Yakama | 50.8 /100 | #172 | Average 75.1% |
| Immigrants | Croatia | 50.2 /100 | #173 | Average 75.1% |
| South Africans | 50.0 /100 | #174 | Average 75.0% |
| Syrians | 49.5 /100 | #175 | Average 75.0% |
| Central Americans | 48.7 /100 | #176 | Average 75.0% |
Demographics Similar to Israelis by In Labor Force | Age 20-24
In terms of in labor force | age 20-24, the demographic groups most similar to Israelis are Iranian (72.6%, a difference of 0.040%), Armenian (72.5%, a difference of 0.070%), Central American Indian (72.7%, a difference of 0.13%), Cuban (72.5%, a difference of 0.14%), and Jamaican (72.7%, a difference of 0.17%).
| Demographics | Rating | Rank | In Labor Force | Age 20-24 |
| Immigrants | Nicaragua | 0.0 /100 | #291 | Tragic 72.9% |
| Pueblo | 0.0 /100 | #292 | Tragic 72.9% |
| Immigrants | Belize | 0.0 /100 | #293 | Tragic 72.8% |
| Immigrants | Argentina | 0.0 /100 | #294 | Tragic 72.8% |
| Okinawans | 0.0 /100 | #295 | Tragic 72.7% |
| Jamaicans | 0.0 /100 | #296 | Tragic 72.7% |
| Central American Indians | 0.0 /100 | #297 | Tragic 72.7% |
| Israelis | 0.0 /100 | #298 | Tragic 72.6% |
| Iranians | 0.0 /100 | #299 | Tragic 72.6% |
| Armenians | 0.0 /100 | #300 | Tragic 72.5% |
| Cubans | 0.0 /100 | #301 | Tragic 72.5% |
| Natives/Alaskans | 0.0 /100 | #302 | Tragic 72.4% |
| Ecuadorians | 0.0 /100 | #303 | Tragic 72.4% |
| Immigrants | West Indies | 0.0 /100 | #304 | Tragic 72.4% |
| Immigrants | Singapore | 0.0 /100 | #305 | Tragic 72.4% |