Immigrants from the Azores vs Israeli In Labor Force | Age 20-24
COMPARE
Immigrants from the Azores
Israeli
In Labor Force | Age 20-24
In Labor Force | Age 20-24 Comparison
Immigrants from the Azores
Israelis
77.2%
IN LABOR FORCE | AGE 20-24
100.0/ 100
METRIC RATING
53rd/ 347
METRIC RANK
72.6%
IN LABOR FORCE | AGE 20-24
0.0/ 100
METRIC RATING
298th/ 347
METRIC RANK
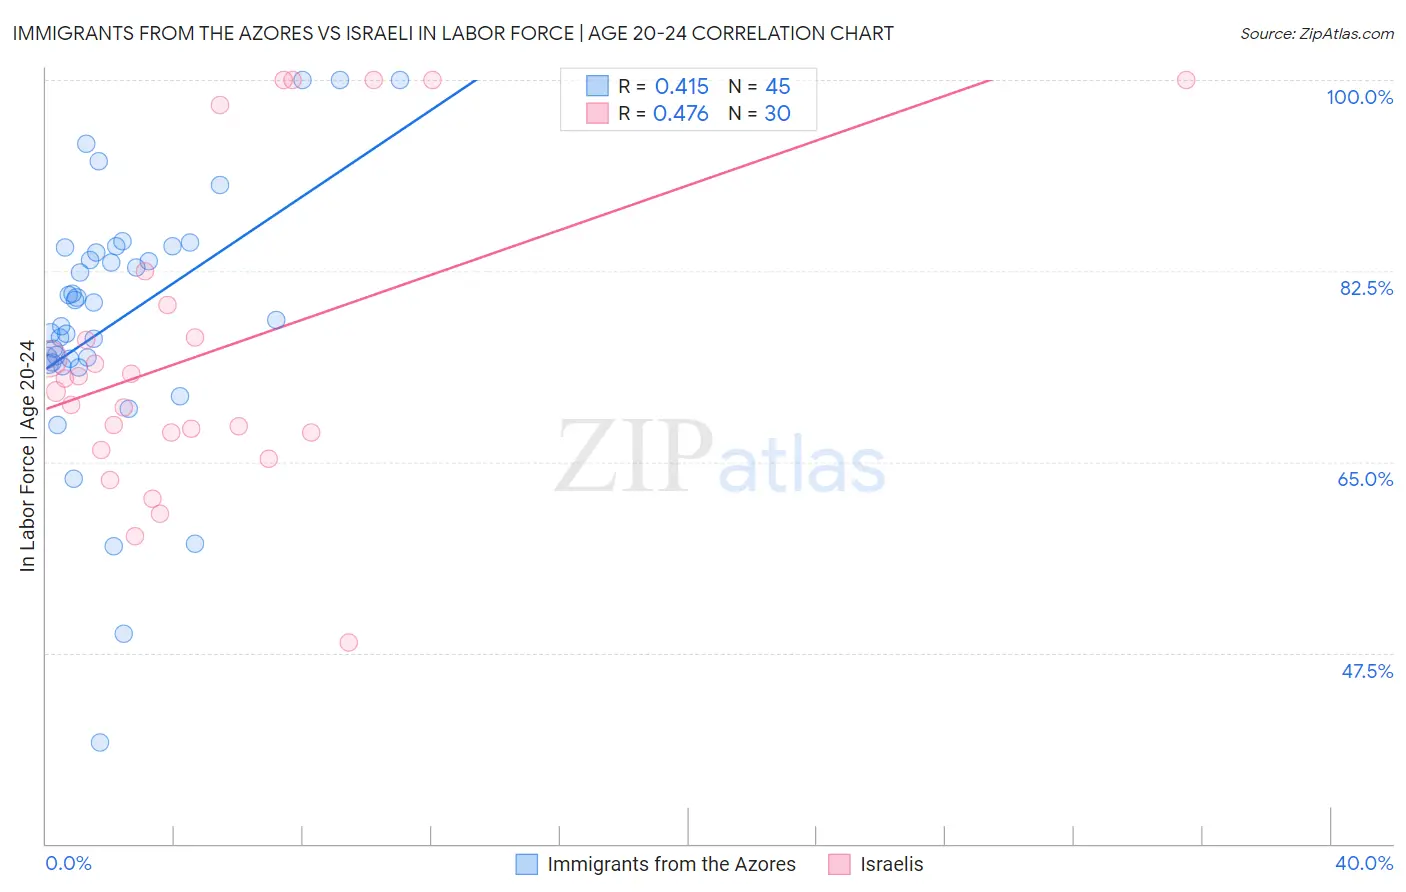
Immigrants from the Azores vs Israeli In Labor Force | Age 20-24 Correlation Chart
The statistical analysis conducted on geographies consisting of 46,250,012 people shows a moderate positive correlation between the proportion of Immigrants from the Azores and labor force participation rate among population between the ages 20 and 24 in the United States with a correlation coefficient (R) of 0.415 and weighted average of 77.2%. Similarly, the statistical analysis conducted on geographies consisting of 211,140,370 people shows a moderate positive correlation between the proportion of Israelis and labor force participation rate among population between the ages 20 and 24 in the United States with a correlation coefficient (R) of 0.476 and weighted average of 72.6%, a difference of 6.4%.
In Labor Force | Age 20-24 Correlation Summary
| Measurement | Immigrants from the Azores | Israeli |
| Minimum | 39.3% | 48.4% |
| Maximum | 100.0% | 100.0% |
| Range | 60.7% | 51.6% |
| Mean | 78.0% | 75.1% |
| Median | 78.0% | 72.0% |
| Interquartile 25% (IQ1) | 74.0% | 67.7% |
| Interquartile 75% (IQ3) | 84.4% | 79.4% |
| Interquartile Range (IQR) | 10.4% | 11.7% |
| Standard Deviation (Sample) | 11.9% | 14.1% |
| Standard Deviation (Population) | 11.8% | 13.8% |
Similar Demographics by In Labor Force | Age 20-24
Demographics Similar to Immigrants from the Azores by In Labor Force | Age 20-24
In terms of in labor force | age 20-24, the demographic groups most similar to Immigrants from the Azores are Indonesian (77.2%, a difference of 0.010%), Croatian (77.2%, a difference of 0.020%), Malaysian (77.2%, a difference of 0.030%), Chinese (77.3%, a difference of 0.070%), and Serbian (77.3%, a difference of 0.080%).
| Demographics | Rating | Rank | In Labor Force | Age 20-24 |
| Samoans | 100.0 /100 | #46 | Exceptional 77.4% |
| Ethiopians | 100.0 /100 | #47 | Exceptional 77.3% |
| Serbians | 100.0 /100 | #48 | Exceptional 77.3% |
| Chinese | 100.0 /100 | #49 | Exceptional 77.3% |
| Malaysians | 100.0 /100 | #50 | Exceptional 77.2% |
| Croatians | 100.0 /100 | #51 | Exceptional 77.2% |
| Indonesians | 100.0 /100 | #52 | Exceptional 77.2% |
| Immigrants | Azores | 100.0 /100 | #53 | Exceptional 77.2% |
| Celtics | 99.9 /100 | #54 | Exceptional 77.1% |
| Immigrants | Liberia | 99.9 /100 | #55 | Exceptional 77.1% |
| Europeans | 99.9 /100 | #56 | Exceptional 77.1% |
| Chippewa | 99.9 /100 | #57 | Exceptional 77.1% |
| Hawaiians | 99.9 /100 | #58 | Exceptional 77.0% |
| Scotch-Irish | 99.9 /100 | #59 | Exceptional 77.0% |
| Kenyans | 99.9 /100 | #60 | Exceptional 77.0% |
Demographics Similar to Israelis by In Labor Force | Age 20-24
In terms of in labor force | age 20-24, the demographic groups most similar to Israelis are Iranian (72.6%, a difference of 0.040%), Armenian (72.5%, a difference of 0.070%), Central American Indian (72.7%, a difference of 0.13%), Cuban (72.5%, a difference of 0.14%), and Jamaican (72.7%, a difference of 0.17%).
| Demographics | Rating | Rank | In Labor Force | Age 20-24 |
| Immigrants | Nicaragua | 0.0 /100 | #291 | Tragic 72.9% |
| Pueblo | 0.0 /100 | #292 | Tragic 72.9% |
| Immigrants | Belize | 0.0 /100 | #293 | Tragic 72.8% |
| Immigrants | Argentina | 0.0 /100 | #294 | Tragic 72.8% |
| Okinawans | 0.0 /100 | #295 | Tragic 72.7% |
| Jamaicans | 0.0 /100 | #296 | Tragic 72.7% |
| Central American Indians | 0.0 /100 | #297 | Tragic 72.7% |
| Israelis | 0.0 /100 | #298 | Tragic 72.6% |
| Iranians | 0.0 /100 | #299 | Tragic 72.6% |
| Armenians | 0.0 /100 | #300 | Tragic 72.5% |
| Cubans | 0.0 /100 | #301 | Tragic 72.5% |
| Natives/Alaskans | 0.0 /100 | #302 | Tragic 72.4% |
| Ecuadorians | 0.0 /100 | #303 | Tragic 72.4% |
| Immigrants | West Indies | 0.0 /100 | #304 | Tragic 72.4% |
| Immigrants | Singapore | 0.0 /100 | #305 | Tragic 72.4% |