Immigrants from Hungary vs Immigrants from South Central Asia In Labor Force | Age 20-64
COMPARE
Immigrants from Hungary
Immigrants from South Central Asia
In Labor Force | Age 20-64
In Labor Force | Age 20-64 Comparison
Immigrants from Hungary
Immigrants from South Central Asia
79.5%
IN LABOR FORCE | AGE 20-64
36.8/ 100
METRIC RATING
183rd/ 347
METRIC RANK
80.7%
IN LABOR FORCE | AGE 20-64
99.9/ 100
METRIC RATING
29th/ 347
METRIC RANK
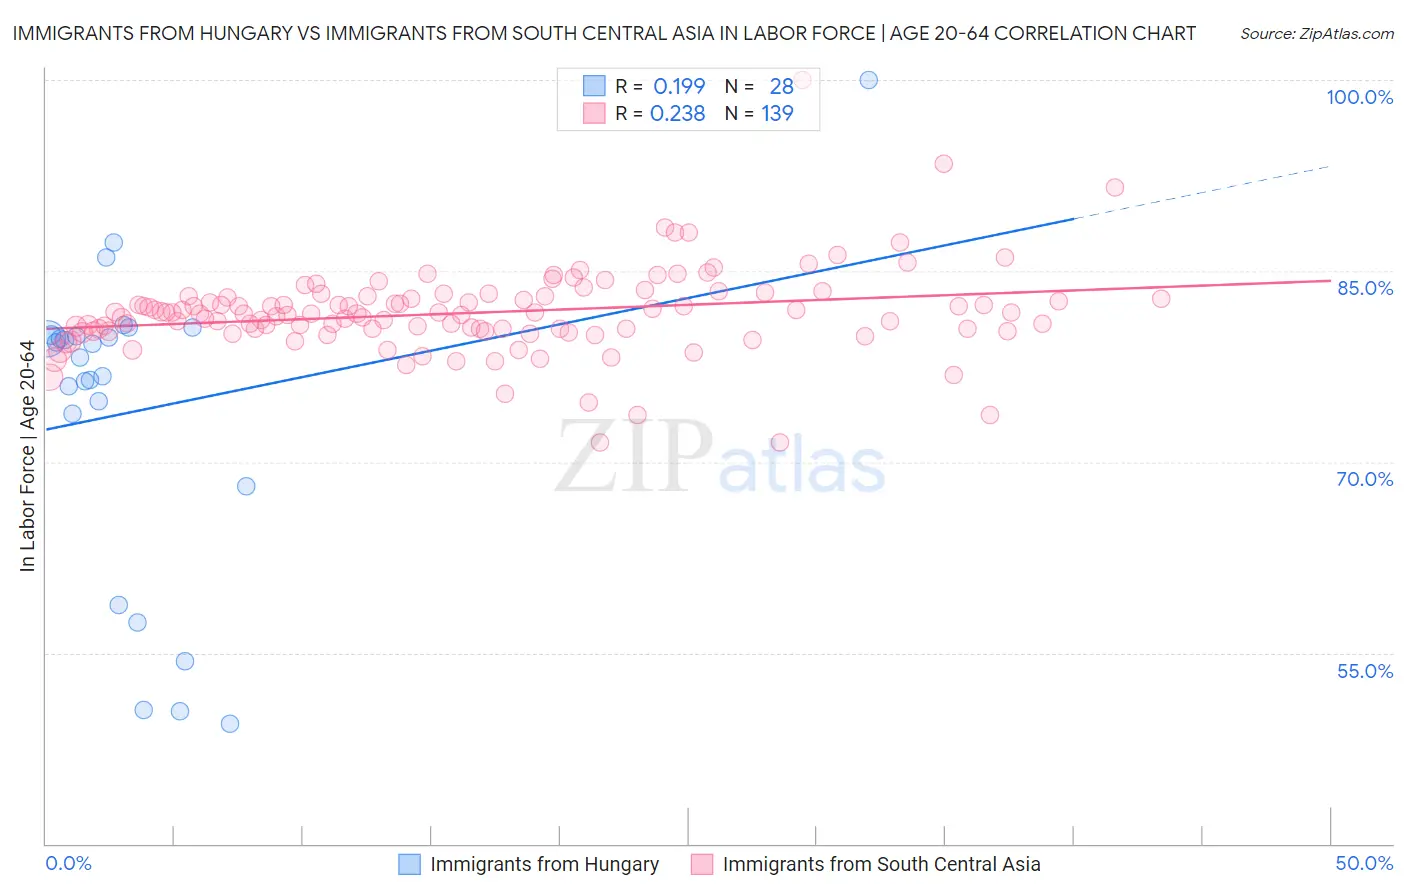
Immigrants from Hungary vs Immigrants from South Central Asia In Labor Force | Age 20-64 Correlation Chart
The statistical analysis conducted on geographies consisting of 195,708,395 people shows a poor positive correlation between the proportion of Immigrants from Hungary and labor force participation rate among population between the ages 20 and 64 in the United States with a correlation coefficient (R) of 0.199 and weighted average of 79.5%. Similarly, the statistical analysis conducted on geographies consisting of 473,125,009 people shows a weak positive correlation between the proportion of Immigrants from South Central Asia and labor force participation rate among population between the ages 20 and 64 in the United States with a correlation coefficient (R) of 0.238 and weighted average of 80.7%, a difference of 1.6%.
In Labor Force | Age 20-64 Correlation Summary
| Measurement | Immigrants from Hungary | Immigrants from South Central Asia |
| Minimum | 49.4% | 71.5% |
| Maximum | 100.0% | 100.0% |
| Range | 50.6% | 28.5% |
| Mean | 74.1% | 81.7% |
| Median | 78.7% | 81.7% |
| Interquartile 25% (IQ1) | 70.9% | 80.3% |
| Interquartile 75% (IQ3) | 79.9% | 83.0% |
| Interquartile Range (IQR) | 9.0% | 2.7% |
| Standard Deviation (Sample) | 12.3% | 3.4% |
| Standard Deviation (Population) | 12.1% | 3.4% |
Similar Demographics by In Labor Force | Age 20-64
Demographics Similar to Immigrants from Hungary by In Labor Force | Age 20-64
In terms of in labor force | age 20-64, the demographic groups most similar to Immigrants from Hungary are Malaysian (79.5%, a difference of 0.0%), Immigrants from Saudi Arabia (79.5%, a difference of 0.010%), Finnish (79.5%, a difference of 0.010%), Israeli (79.5%, a difference of 0.020%), and Northern European (79.5%, a difference of 0.020%).
| Demographics | Rating | Rank | In Labor Force | Age 20-64 |
| Australians | 46.0 /100 | #176 | Average 79.5% |
| Immigrants | Netherlands | 45.2 /100 | #177 | Average 79.5% |
| Czechoslovakians | 44.3 /100 | #178 | Average 79.5% |
| Armenians | 41.4 /100 | #179 | Average 79.5% |
| Salvadorans | 41.0 /100 | #180 | Average 79.5% |
| Immigrants | Saudi Arabia | 37.7 /100 | #181 | Fair 79.5% |
| Malaysians | 37.1 /100 | #182 | Fair 79.5% |
| Immigrants | Hungary | 36.8 /100 | #183 | Fair 79.5% |
| Finns | 35.9 /100 | #184 | Fair 79.5% |
| Israelis | 34.7 /100 | #185 | Fair 79.5% |
| Northern Europeans | 34.5 /100 | #186 | Fair 79.5% |
| Assyrians/Chaldeans/Syriacs | 33.3 /100 | #187 | Fair 79.4% |
| Immigrants | Haiti | 32.1 /100 | #188 | Fair 79.4% |
| Immigrants | El Salvador | 30.9 /100 | #189 | Fair 79.4% |
| Immigrants | Syria | 30.8 /100 | #190 | Fair 79.4% |
Demographics Similar to Immigrants from South Central Asia by In Labor Force | Age 20-64
In terms of in labor force | age 20-64, the demographic groups most similar to Immigrants from South Central Asia are Immigrants from North Macedonia (80.7%, a difference of 0.010%), Immigrants from Uganda (80.7%, a difference of 0.020%), Immigrants from Lithuania (80.7%, a difference of 0.020%), Immigrants from Kenya (80.7%, a difference of 0.030%), and Immigrants from Ireland (80.7%, a difference of 0.030%).
| Demographics | Rating | Rank | In Labor Force | Age 20-64 |
| Sudanese | 100.0 /100 | #22 | Exceptional 80.8% |
| Immigrants | Bosnia and Herzegovina | 100.0 /100 | #23 | Exceptional 80.8% |
| Immigrants | Morocco | 100.0 /100 | #24 | Exceptional 80.8% |
| Kenyans | 100.0 /100 | #25 | Exceptional 80.8% |
| Immigrants | Serbia | 100.0 /100 | #26 | Exceptional 80.8% |
| Immigrants | Kenya | 99.9 /100 | #27 | Exceptional 80.7% |
| Immigrants | Uganda | 99.9 /100 | #28 | Exceptional 80.7% |
| Immigrants | South Central Asia | 99.9 /100 | #29 | Exceptional 80.7% |
| Immigrants | North Macedonia | 99.9 /100 | #30 | Exceptional 80.7% |
| Immigrants | Lithuania | 99.9 /100 | #31 | Exceptional 80.7% |
| Immigrants | Ireland | 99.9 /100 | #32 | Exceptional 80.7% |
| Chinese | 99.9 /100 | #33 | Exceptional 80.7% |
| Immigrants | Brazil | 99.9 /100 | #34 | Exceptional 80.7% |
| Immigrants | Poland | 99.9 /100 | #35 | Exceptional 80.6% |
| Paraguayans | 99.8 /100 | #36 | Exceptional 80.6% |