Immigrants from Hungary vs Immigrants from South Central Asia Female Poverty Among 18-24 Year Olds
COMPARE
Immigrants from Hungary
Immigrants from South Central Asia
Female Poverty Among 18-24 Year Olds
Female Poverty Among 18-24 Year Olds Comparison
Immigrants from Hungary
Immigrants from South Central Asia
19.3%
FEMALE POVERTY AMONG 18-24 YEAR OLDS
96.2/ 100
METRIC RATING
115th/ 347
METRIC RANK
17.6%
FEMALE POVERTY AMONG 18-24 YEAR OLDS
100.0/ 100
METRIC RATING
25th/ 347
METRIC RANK
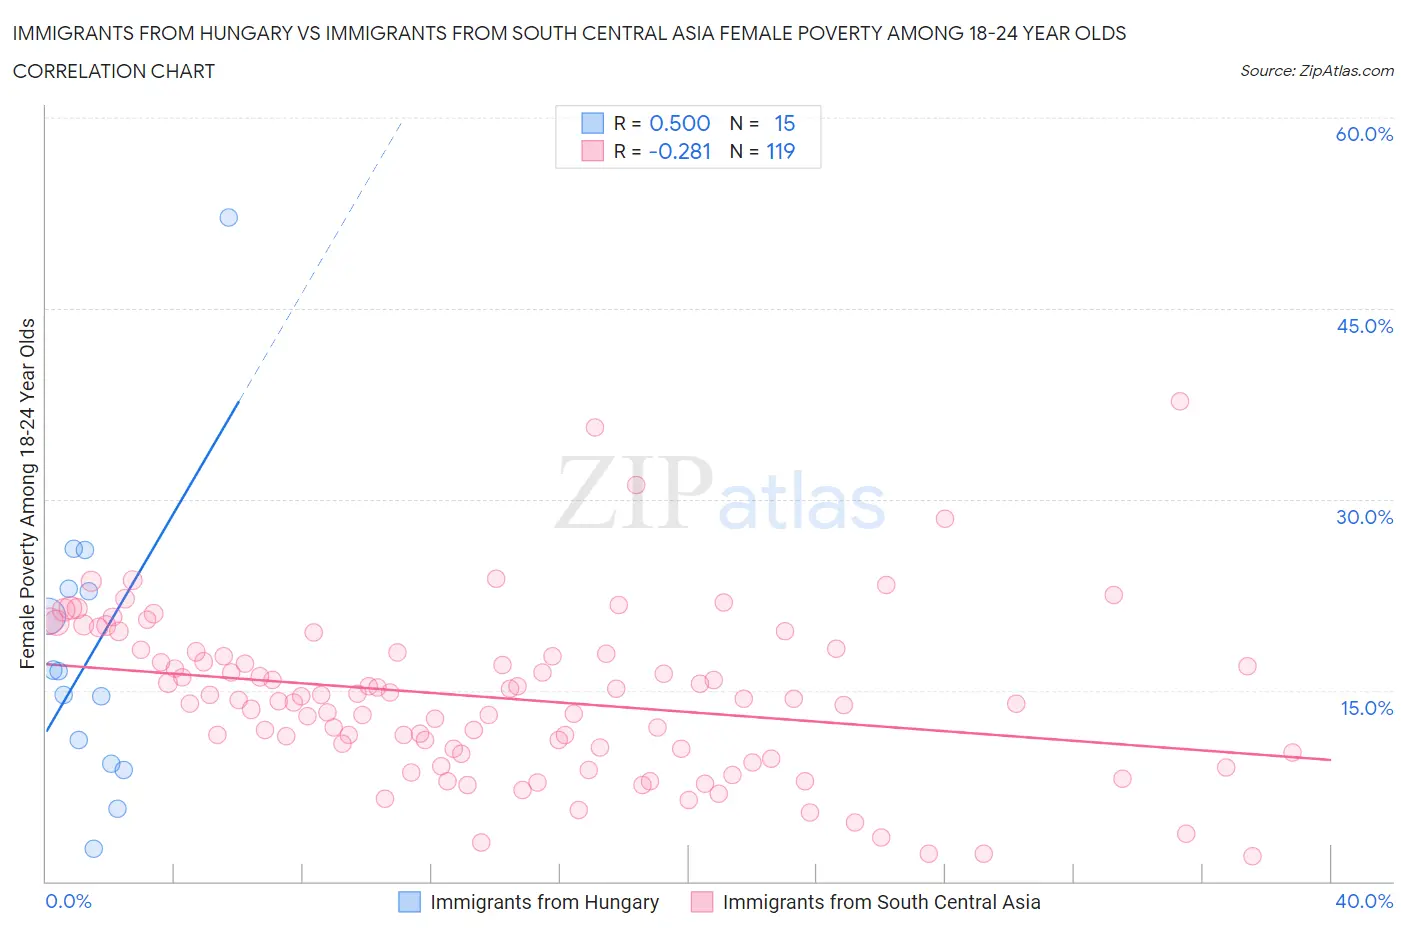
Immigrants from Hungary vs Immigrants from South Central Asia Female Poverty Among 18-24 Year Olds Correlation Chart
The statistical analysis conducted on geographies consisting of 192,436,137 people shows a moderate positive correlation between the proportion of Immigrants from Hungary and poverty level among females between the ages 18 and 24 in the United States with a correlation coefficient (R) of 0.500 and weighted average of 19.3%. Similarly, the statistical analysis conducted on geographies consisting of 457,387,696 people shows a weak negative correlation between the proportion of Immigrants from South Central Asia and poverty level among females between the ages 18 and 24 in the United States with a correlation coefficient (R) of -0.281 and weighted average of 17.6%, a difference of 9.7%.
Female Poverty Among 18-24 Year Olds Correlation Summary
| Measurement | Immigrants from Hungary | Immigrants from South Central Asia |
| Minimum | 2.6% | 1.9% |
| Maximum | 52.2% | 37.7% |
| Range | 49.6% | 35.8% |
| Mean | 18.0% | 14.4% |
| Median | 16.5% | 14.4% |
| Interquartile 25% (IQ1) | 9.2% | 10.1% |
| Interquartile 75% (IQ3) | 23.0% | 18.0% |
| Interquartile Range (IQR) | 13.7% | 7.9% |
| Standard Deviation (Sample) | 11.9% | 6.4% |
| Standard Deviation (Population) | 11.5% | 6.4% |
Similar Demographics by Female Poverty Among 18-24 Year Olds
Demographics Similar to Immigrants from Hungary by Female Poverty Among 18-24 Year Olds
In terms of female poverty among 18-24 year olds, the demographic groups most similar to Immigrants from Hungary are Slovene (19.3%, a difference of 0.010%), Immigrants from Cameroon (19.3%, a difference of 0.050%), Immigrants (19.3%, a difference of 0.10%), Immigrants from El Salvador (19.3%, a difference of 0.11%), and Immigrants from Iran (19.3%, a difference of 0.14%).
| Demographics | Rating | Rank | Female Poverty Among 18-24 Year Olds |
| Immigrants | Uzbekistan | 97.3 /100 | #108 | Exceptional 19.2% |
| Immigrants | Syria | 97.2 /100 | #109 | Exceptional 19.2% |
| Laotians | 97.1 /100 | #110 | Exceptional 19.2% |
| Immigrants | Serbia | 97.1 /100 | #111 | Exceptional 19.2% |
| Immigrants | El Salvador | 96.5 /100 | #112 | Exceptional 19.3% |
| Immigrants | Cameroon | 96.3 /100 | #113 | Exceptional 19.3% |
| Slovenes | 96.2 /100 | #114 | Exceptional 19.3% |
| Immigrants | Hungary | 96.2 /100 | #115 | Exceptional 19.3% |
| Immigrants | Immigrants | 95.9 /100 | #116 | Exceptional 19.3% |
| Immigrants | Iran | 95.8 /100 | #117 | Exceptional 19.3% |
| Immigrants | Guyana | 95.6 /100 | #118 | Exceptional 19.3% |
| Cypriots | 95.5 /100 | #119 | Exceptional 19.3% |
| Immigrants | Northern Europe | 95.4 /100 | #120 | Exceptional 19.4% |
| Guyanese | 95.3 /100 | #121 | Exceptional 19.4% |
| Cambodians | 94.6 /100 | #122 | Exceptional 19.4% |
Demographics Similar to Immigrants from South Central Asia by Female Poverty Among 18-24 Year Olds
In terms of female poverty among 18-24 year olds, the demographic groups most similar to Immigrants from South Central Asia are Maltese (17.6%, a difference of 0.18%), Immigrants from North Macedonia (17.6%, a difference of 0.25%), Immigrants from Fiji (17.7%, a difference of 0.33%), Colombian (17.7%, a difference of 0.43%), and Venezuelan (17.7%, a difference of 0.57%).
| Demographics | Rating | Rank | Female Poverty Among 18-24 Year Olds |
| Immigrants | Colombia | 100.0 /100 | #18 | Exceptional 17.3% |
| Immigrants | Lithuania | 100.0 /100 | #19 | Exceptional 17.4% |
| Immigrants | Venezuela | 100.0 /100 | #20 | Exceptional 17.4% |
| Bolivians | 100.0 /100 | #21 | Exceptional 17.4% |
| Immigrants | Hong Kong | 100.0 /100 | #22 | Exceptional 17.5% |
| Immigrants | North Macedonia | 100.0 /100 | #23 | Exceptional 17.6% |
| Maltese | 100.0 /100 | #24 | Exceptional 17.6% |
| Immigrants | South Central Asia | 100.0 /100 | #25 | Exceptional 17.6% |
| Immigrants | Fiji | 100.0 /100 | #26 | Exceptional 17.7% |
| Colombians | 100.0 /100 | #27 | Exceptional 17.7% |
| Venezuelans | 100.0 /100 | #28 | Exceptional 17.7% |
| Portuguese | 100.0 /100 | #29 | Exceptional 17.8% |
| Immigrants | South Eastern Asia | 100.0 /100 | #30 | Exceptional 17.8% |
| Immigrants | Vietnam | 100.0 /100 | #31 | Exceptional 17.8% |
| Immigrants | Moldova | 100.0 /100 | #32 | Exceptional 17.9% |