Immigrants from Hungary vs Immigrants from South Central Asia 9th Grade
COMPARE
Immigrants from Hungary
Immigrants from South Central Asia
9th Grade
9th Grade Comparison
Immigrants from Hungary
Immigrants from South Central Asia
95.4%
9TH GRADE
94.2/ 100
METRIC RATING
128th/ 347
METRIC RANK
95.4%
9TH GRADE
95.1/ 100
METRIC RATING
125th/ 347
METRIC RANK
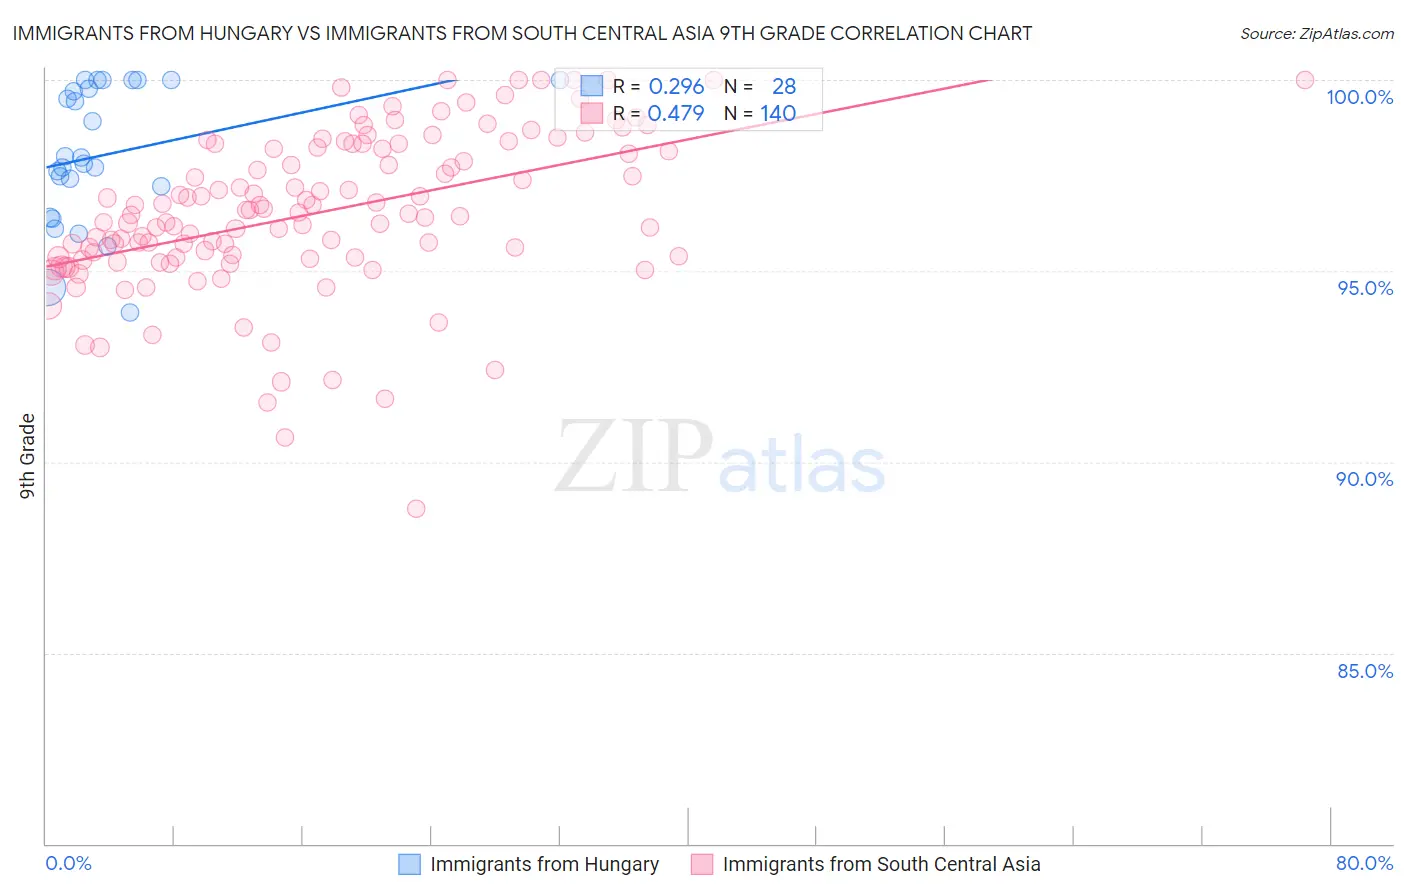
Immigrants from Hungary vs Immigrants from South Central Asia 9th Grade Correlation Chart
The statistical analysis conducted on geographies consisting of 195,707,305 people shows a weak positive correlation between the proportion of Immigrants from Hungary and percentage of population with at least 9th grade education in the United States with a correlation coefficient (R) of 0.296 and weighted average of 95.4%. Similarly, the statistical analysis conducted on geographies consisting of 473,113,181 people shows a moderate positive correlation between the proportion of Immigrants from South Central Asia and percentage of population with at least 9th grade education in the United States with a correlation coefficient (R) of 0.479 and weighted average of 95.4%, a difference of 0.030%.
9th Grade Correlation Summary
| Measurement | Immigrants from Hungary | Immigrants from South Central Asia |
| Minimum | 93.9% | 88.8% |
| Maximum | 100.0% | 100.0% |
| Range | 6.1% | 11.2% |
| Mean | 98.0% | 96.5% |
| Median | 97.9% | 96.5% |
| Interquartile 25% (IQ1) | 96.8% | 95.4% |
| Interquartile 75% (IQ3) | 99.9% | 98.2% |
| Interquartile Range (IQR) | 3.1% | 2.9% |
| Standard Deviation (Sample) | 1.8% | 2.1% |
| Standard Deviation (Population) | 1.8% | 2.1% |
Demographics Similar to Immigrants from Hungary and Immigrants from South Central Asia by 9th Grade
In terms of 9th grade, the demographic groups most similar to Immigrants from Hungary are Palestinian (95.4%, a difference of 0.0%), Basque (95.4%, a difference of 0.0%), Immigrants from Serbia (95.4%, a difference of 0.010%), Jordanian (95.3%, a difference of 0.020%), and Kiowa (95.4%, a difference of 0.040%). Similarly, the demographic groups most similar to Immigrants from South Central Asia are Kiowa (95.4%, a difference of 0.010%), Shoshone (95.4%, a difference of 0.010%), Immigrants from Romania (95.4%, a difference of 0.020%), Immigrants from Turkey (95.4%, a difference of 0.020%), and Soviet Union (95.4%, a difference of 0.020%).
| Demographics | Rating | Rank | 9th Grade |
| Immigrants | Europe | 95.7 /100 | #116 | Exceptional 95.4% |
| Immigrants | Romania | 95.6 /100 | #117 | Exceptional 95.4% |
| Immigrants | Turkey | 95.6 /100 | #118 | Exceptional 95.4% |
| Soviet Union | 95.6 /100 | #119 | Exceptional 95.4% |
| Cambodians | 95.6 /100 | #120 | Exceptional 95.4% |
| Cree | 95.5 /100 | #121 | Exceptional 95.4% |
| Immigrants | Kuwait | 95.5 /100 | #122 | Exceptional 95.4% |
| Kiowa | 95.3 /100 | #123 | Exceptional 95.4% |
| Shoshone | 95.3 /100 | #124 | Exceptional 95.4% |
| Immigrants | South Central Asia | 95.1 /100 | #125 | Exceptional 95.4% |
| Immigrants | Serbia | 94.4 /100 | #126 | Exceptional 95.4% |
| Palestinians | 94.3 /100 | #127 | Exceptional 95.4% |
| Immigrants | Hungary | 94.2 /100 | #128 | Exceptional 95.4% |
| Basques | 94.1 /100 | #129 | Exceptional 95.4% |
| Jordanians | 93.5 /100 | #130 | Exceptional 95.3% |
| Immigrants | North Macedonia | 92.3 /100 | #131 | Exceptional 95.3% |
| Immigrants | Nonimmigrants | 92.0 /100 | #132 | Exceptional 95.3% |
| Israelis | 90.4 /100 | #133 | Exceptional 95.3% |
| Immigrants | Israel | 89.6 /100 | #134 | Excellent 95.3% |
| Immigrants | Belarus | 88.9 /100 | #135 | Excellent 95.2% |
| Immigrants | Iran | 88.3 /100 | #136 | Excellent 95.2% |