Immigrants from Hong Kong vs Iraqi Unemployment
COMPARE
Immigrants from Hong Kong
Iraqi
Unemployment
Unemployment Comparison
Immigrants from Hong Kong
Iraqis
5.2%
UNEMPLOYMENT
75.2/ 100
METRIC RATING
152nd/ 347
METRIC RANK
5.4%
UNEMPLOYMENT
18.1/ 100
METRIC RATING
211th/ 347
METRIC RANK
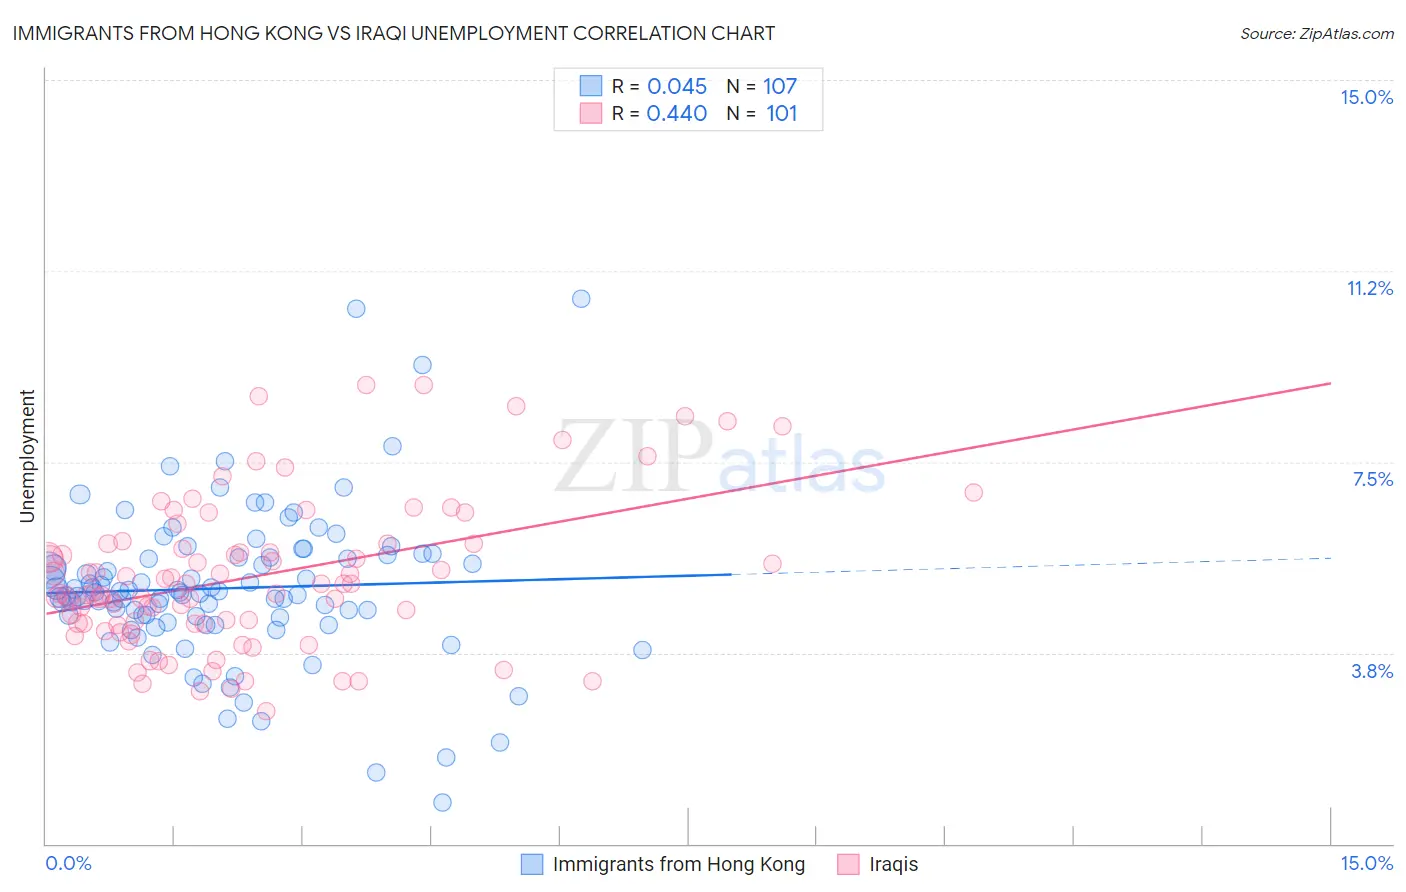
Immigrants from Hong Kong vs Iraqi Unemployment Correlation Chart
The statistical analysis conducted on geographies consisting of 253,937,877 people shows no correlation between the proportion of Immigrants from Hong Kong and unemployment in the United States with a correlation coefficient (R) of 0.045 and weighted average of 5.2%. Similarly, the statistical analysis conducted on geographies consisting of 170,626,447 people shows a moderate positive correlation between the proportion of Iraqis and unemployment in the United States with a correlation coefficient (R) of 0.440 and weighted average of 5.4%, a difference of 4.1%.
Unemployment Correlation Summary
| Measurement | Immigrants from Hong Kong | Iraqi |
| Minimum | 0.80% | 2.6% |
| Maximum | 10.7% | 9.0% |
| Range | 9.9% | 6.4% |
| Mean | 5.0% | 5.2% |
| Median | 4.9% | 4.9% |
| Interquartile 25% (IQ1) | 4.4% | 4.3% |
| Interquartile 75% (IQ3) | 5.6% | 5.9% |
| Interquartile Range (IQR) | 1.2% | 1.6% |
| Standard Deviation (Sample) | 1.5% | 1.5% |
| Standard Deviation (Population) | 1.5% | 1.4% |
Similar Demographics by Unemployment
Demographics Similar to Immigrants from Hong Kong by Unemployment
In terms of unemployment, the demographic groups most similar to Immigrants from Hong Kong are Egyptian (5.2%, a difference of 0.0%), Immigrants from Eastern Europe (5.2%, a difference of 0.010%), Immigrants from China (5.2%, a difference of 0.040%), Potawatomi (5.2%, a difference of 0.080%), and Syrian (5.2%, a difference of 0.22%).
| Demographics | Rating | Rank | Unemployment |
| Immigrants | Norway | 81.8 /100 | #145 | Excellent 5.1% |
| Immigrants | Asia | 81.8 /100 | #146 | Excellent 5.1% |
| Indians (Asian) | 81.6 /100 | #147 | Excellent 5.1% |
| Immigrants | Italy | 79.1 /100 | #148 | Good 5.1% |
| Syrians | 77.7 /100 | #149 | Good 5.2% |
| Potawatomi | 76.2 /100 | #150 | Good 5.2% |
| Immigrants | Eastern Europe | 75.3 /100 | #151 | Good 5.2% |
| Immigrants | Hong Kong | 75.2 /100 | #152 | Good 5.2% |
| Egyptians | 75.2 /100 | #153 | Good 5.2% |
| Immigrants | China | 74.7 /100 | #154 | Good 5.2% |
| Immigrants | Northern Africa | 71.3 /100 | #155 | Good 5.2% |
| Immigrants | Kazakhstan | 70.4 /100 | #156 | Good 5.2% |
| Sri Lankans | 69.5 /100 | #157 | Good 5.2% |
| Immigrants | Egypt | 66.7 /100 | #158 | Good 5.2% |
| Immigrants | Russia | 66.6 /100 | #159 | Good 5.2% |
Demographics Similar to Iraqis by Unemployment
In terms of unemployment, the demographic groups most similar to Iraqis are Ugandan (5.4%, a difference of 0.010%), Immigrants from Iraq (5.4%, a difference of 0.050%), Immigrants from Iran (5.4%, a difference of 0.070%), Portuguese (5.4%, a difference of 0.10%), and Creek (5.4%, a difference of 0.13%).
| Demographics | Rating | Rank | Unemployment |
| Immigrants | Ukraine | 24.9 /100 | #204 | Fair 5.3% |
| Native Hawaiians | 24.1 /100 | #205 | Fair 5.3% |
| Immigrants | Peru | 22.7 /100 | #206 | Fair 5.4% |
| Creek | 19.4 /100 | #207 | Poor 5.4% |
| Portuguese | 19.0 /100 | #208 | Poor 5.4% |
| Immigrants | Iran | 18.8 /100 | #209 | Poor 5.4% |
| Immigrants | Iraq | 18.6 /100 | #210 | Poor 5.4% |
| Iraqis | 18.1 /100 | #211 | Poor 5.4% |
| Ugandans | 18.0 /100 | #212 | Poor 5.4% |
| Immigrants | Middle Africa | 15.3 /100 | #213 | Poor 5.4% |
| Immigrants | Costa Rica | 15.2 /100 | #214 | Poor 5.4% |
| Delaware | 14.7 /100 | #215 | Poor 5.4% |
| Immigrants | South America | 13.5 /100 | #216 | Poor 5.4% |
| Immigrants | Albania | 13.5 /100 | #217 | Poor 5.4% |
| Choctaw | 12.7 /100 | #218 | Poor 5.4% |