Aleut vs Iraqi In Labor Force | Age 25-29
COMPARE
Aleut
Iraqi
In Labor Force | Age 25-29
In Labor Force | Age 25-29 Comparison
Aleuts
Iraqis
83.4%
IN LABOR FORCE | AGE 25-29
0.0/ 100
METRIC RATING
266th/ 347
METRIC RANK
83.9%
IN LABOR FORCE | AGE 25-29
0.9/ 100
METRIC RATING
235th/ 347
METRIC RANK
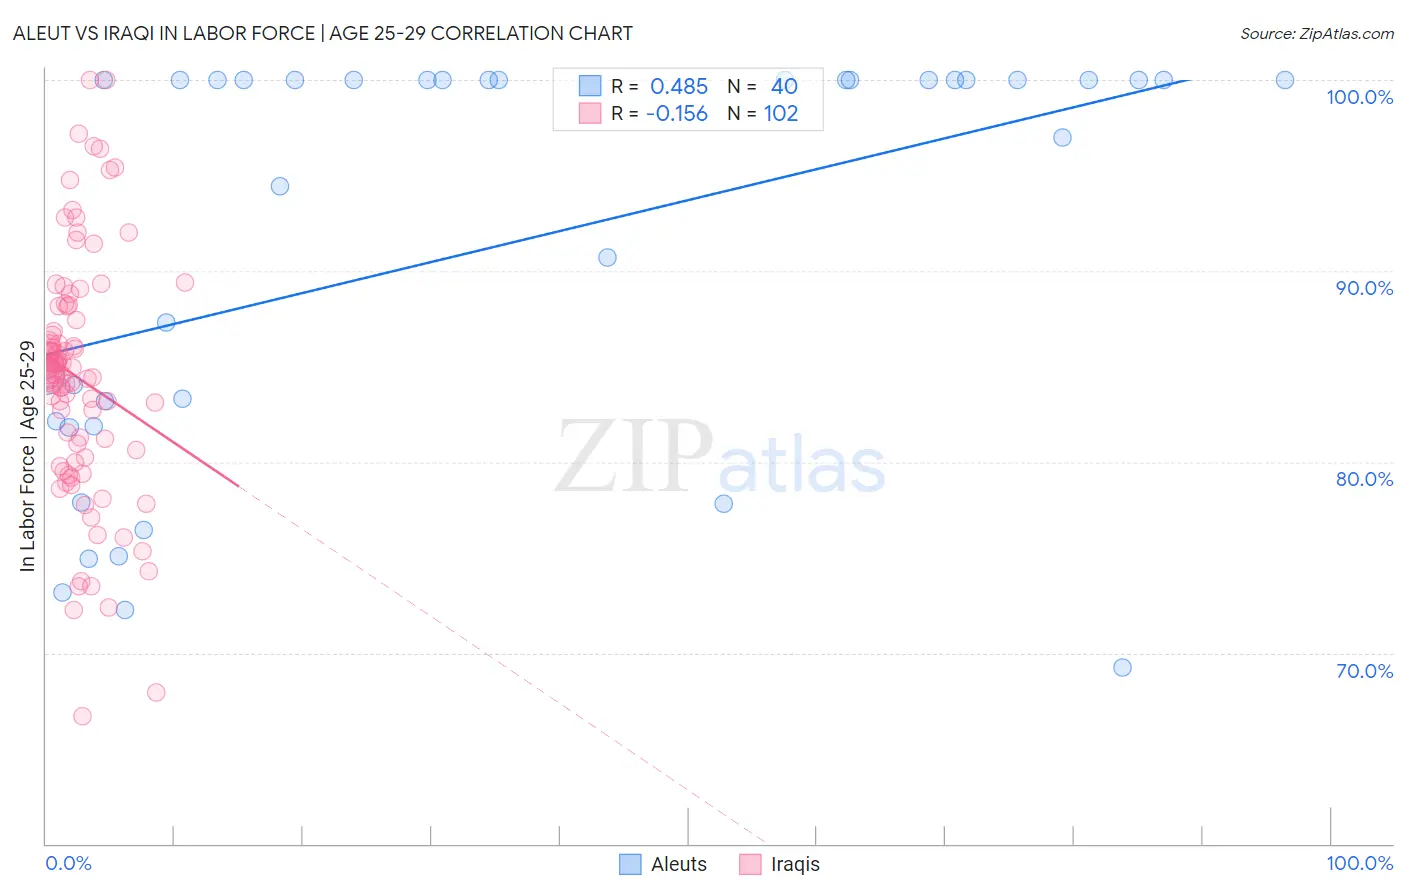
Aleut vs Iraqi In Labor Force | Age 25-29 Correlation Chart
The statistical analysis conducted on geographies consisting of 61,770,091 people shows a moderate positive correlation between the proportion of Aleuts and labor force participation rate among population between the ages 25 and 29 in the United States with a correlation coefficient (R) of 0.485 and weighted average of 83.4%. Similarly, the statistical analysis conducted on geographies consisting of 170,636,038 people shows a poor negative correlation between the proportion of Iraqis and labor force participation rate among population between the ages 25 and 29 in the United States with a correlation coefficient (R) of -0.156 and weighted average of 83.9%, a difference of 0.59%.
In Labor Force | Age 25-29 Correlation Summary
| Measurement | Aleut | Iraqi |
| Minimum | 69.2% | 66.7% |
| Maximum | 100.0% | 100.0% |
| Range | 30.8% | 33.3% |
| Mean | 91.2% | 84.4% |
| Median | 100.0% | 84.8% |
| Interquartile 25% (IQ1) | 82.0% | 80.6% |
| Interquartile 75% (IQ3) | 100.0% | 87.5% |
| Interquartile Range (IQR) | 18.0% | 6.9% |
| Standard Deviation (Sample) | 10.7% | 6.3% |
| Standard Deviation (Population) | 10.5% | 6.3% |
Similar Demographics by In Labor Force | Age 25-29
Demographics Similar to Aleuts by In Labor Force | Age 25-29
In terms of in labor force | age 25-29, the demographic groups most similar to Aleuts are Spanish American (83.4%, a difference of 0.010%), Immigrants from Lebanon (83.4%, a difference of 0.020%), Immigrants from Barbados (83.4%, a difference of 0.020%), Puget Sound Salish (83.5%, a difference of 0.040%), and Cuban (83.5%, a difference of 0.040%).
| Demographics | Rating | Rank | In Labor Force | Age 25-29 |
| Spanish | 0.1 /100 | #259 | Tragic 83.6% |
| Immigrants | Bahamas | 0.1 /100 | #260 | Tragic 83.6% |
| Pennsylvania Germans | 0.1 /100 | #261 | Tragic 83.6% |
| Immigrants | Fiji | 0.1 /100 | #262 | Tragic 83.6% |
| West Indians | 0.1 /100 | #263 | Tragic 83.5% |
| Puget Sound Salish | 0.1 /100 | #264 | Tragic 83.5% |
| Cubans | 0.1 /100 | #265 | Tragic 83.5% |
| Aleuts | 0.0 /100 | #266 | Tragic 83.4% |
| Spanish Americans | 0.0 /100 | #267 | Tragic 83.4% |
| Immigrants | Lebanon | 0.0 /100 | #268 | Tragic 83.4% |
| Immigrants | Barbados | 0.0 /100 | #269 | Tragic 83.4% |
| Basques | 0.0 /100 | #270 | Tragic 83.4% |
| Hondurans | 0.0 /100 | #271 | Tragic 83.4% |
| Immigrants | Caribbean | 0.0 /100 | #272 | Tragic 83.4% |
| Immigrants | Dominica | 0.0 /100 | #273 | Tragic 83.4% |
Demographics Similar to Iraqis by In Labor Force | Age 25-29
In terms of in labor force | age 25-29, the demographic groups most similar to Iraqis are Guamanian/Chamorro (83.9%, a difference of 0.0%), Immigrants (83.9%, a difference of 0.010%), Barbadian (83.9%, a difference of 0.020%), Immigrants from Uzbekistan (83.9%, a difference of 0.030%), and Jamaican (83.9%, a difference of 0.040%).
| Demographics | Rating | Rank | In Labor Force | Age 25-29 |
| Immigrants | Panama | 5.5 /100 | #228 | Tragic 84.2% |
| Immigrants | Oceania | 5.0 /100 | #229 | Tragic 84.2% |
| Whites/Caucasians | 4.8 /100 | #230 | Tragic 84.2% |
| Immigrants | Philippines | 4.7 /100 | #231 | Tragic 84.2% |
| Panamanians | 4.5 /100 | #232 | Tragic 84.2% |
| Immigrants | Western Asia | 2.7 /100 | #233 | Tragic 84.1% |
| Barbadians | 1.0 /100 | #234 | Tragic 83.9% |
| Iraqis | 0.9 /100 | #235 | Tragic 83.9% |
| Guamanians/Chamorros | 0.9 /100 | #236 | Tragic 83.9% |
| Immigrants | Immigrants | 0.9 /100 | #237 | Tragic 83.9% |
| Immigrants | Uzbekistan | 0.8 /100 | #238 | Tragic 83.9% |
| Jamaicans | 0.8 /100 | #239 | Tragic 83.9% |
| Trinidadians and Tobagonians | 0.7 /100 | #240 | Tragic 83.9% |
| Alsatians | 0.7 /100 | #241 | Tragic 83.9% |
| U.S. Virgin Islanders | 0.6 /100 | #242 | Tragic 83.8% |