Immigrants from Honduras vs Immigrants from Europe In Labor Force | Age 45-54
COMPARE
Immigrants from Honduras
Immigrants from Europe
In Labor Force | Age 45-54
In Labor Force | Age 45-54 Comparison
Immigrants from Honduras
Immigrants from Europe
81.4%
IN LABOR FORCE | AGE 45-54
0.0/ 100
METRIC RATING
268th/ 347
METRIC RANK
83.2%
IN LABOR FORCE | AGE 45-54
90.7/ 100
METRIC RATING
118th/ 347
METRIC RANK
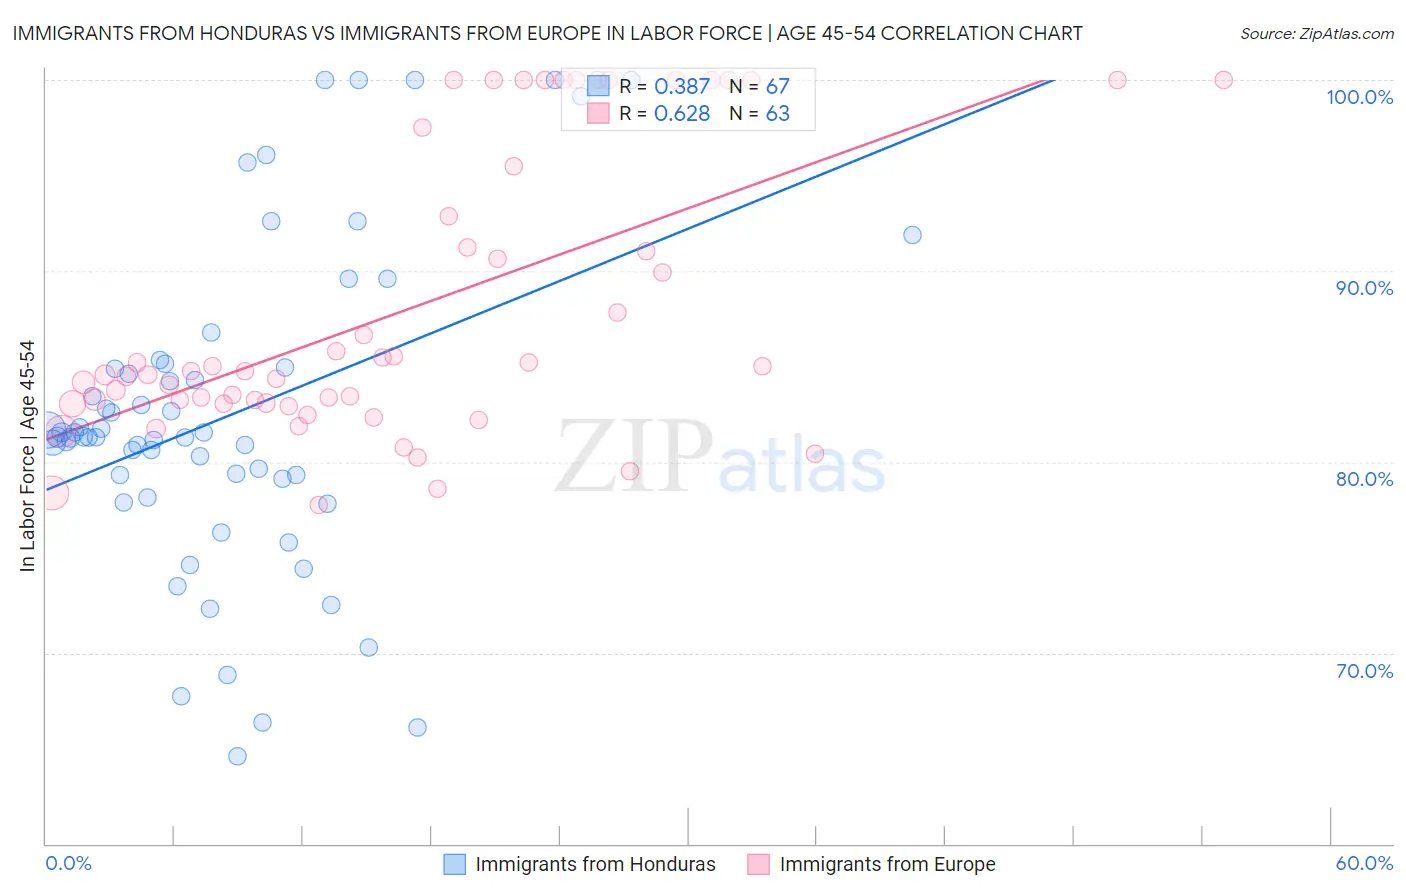
Immigrants from Honduras vs Immigrants from Europe In Labor Force | Age 45-54 Correlation Chart
The statistical analysis conducted on geographies consisting of 322,456,034 people shows a mild positive correlation between the proportion of Immigrants from Honduras and labor force participation rate among population between the ages 45 and 54 in the United States with a correlation coefficient (R) of 0.387 and weighted average of 81.4%. Similarly, the statistical analysis conducted on geographies consisting of 546,802,439 people shows a significant positive correlation between the proportion of Immigrants from Europe and labor force participation rate among population between the ages 45 and 54 in the United States with a correlation coefficient (R) of 0.628 and weighted average of 83.2%, a difference of 2.2%.
In Labor Force | Age 45-54 Correlation Summary
| Measurement | Immigrants from Honduras | Immigrants from Europe |
| Minimum | 64.6% | 77.7% |
| Maximum | 100.0% | 100.0% |
| Range | 35.4% | 22.3% |
| Mean | 82.4% | 88.0% |
| Median | 81.3% | 84.7% |
| Interquartile 25% (IQ1) | 79.1% | 83.1% |
| Interquartile 75% (IQ3) | 84.9% | 95.5% |
| Interquartile Range (IQR) | 5.8% | 12.4% |
| Standard Deviation (Sample) | 8.4% | 7.4% |
| Standard Deviation (Population) | 8.3% | 7.3% |
Similar Demographics by In Labor Force | Age 45-54
Demographics Similar to Immigrants from Honduras by In Labor Force | Age 45-54
In terms of in labor force | age 45-54, the demographic groups most similar to Immigrants from Honduras are West Indian (81.4%, a difference of 0.020%), Alsatian (81.3%, a difference of 0.020%), Immigrants from St. Vincent and the Grenadines (81.4%, a difference of 0.030%), Bangladeshi (81.3%, a difference of 0.050%), and Immigrants from Barbados (81.3%, a difference of 0.060%).
| Demographics | Rating | Rank | In Labor Force | Age 45-54 |
| Hawaiians | 0.1 /100 | #261 | Tragic 81.5% |
| Immigrants | Guyana | 0.1 /100 | #262 | Tragic 81.5% |
| Indonesians | 0.1 /100 | #263 | Tragic 81.5% |
| Immigrants | West Indies | 0.1 /100 | #264 | Tragic 81.5% |
| Hondurans | 0.1 /100 | #265 | Tragic 81.4% |
| Immigrants | St. Vincent and the Grenadines | 0.1 /100 | #266 | Tragic 81.4% |
| West Indians | 0.1 /100 | #267 | Tragic 81.4% |
| Immigrants | Honduras | 0.0 /100 | #268 | Tragic 81.4% |
| Alsatians | 0.0 /100 | #269 | Tragic 81.3% |
| Bangladeshis | 0.0 /100 | #270 | Tragic 81.3% |
| Immigrants | Barbados | 0.0 /100 | #271 | Tragic 81.3% |
| Spanish | 0.0 /100 | #272 | Tragic 81.3% |
| Chippewa | 0.0 /100 | #273 | Tragic 81.3% |
| British West Indians | 0.0 /100 | #274 | Tragic 81.2% |
| Immigrants | Nonimmigrants | 0.0 /100 | #275 | Tragic 81.2% |
Demographics Similar to Immigrants from Europe by In Labor Force | Age 45-54
In terms of in labor force | age 45-54, the demographic groups most similar to Immigrants from Europe are Immigrants from China (83.2%, a difference of 0.010%), Immigrants from Uruguay (83.2%, a difference of 0.010%), Immigrants from Russia (83.2%, a difference of 0.010%), Immigrants from Chile (83.2%, a difference of 0.020%), and Immigrants from Malaysia (83.2%, a difference of 0.020%).
| Demographics | Rating | Rank | In Labor Force | Age 45-54 |
| Immigrants | Italy | 92.5 /100 | #111 | Exceptional 83.2% |
| Immigrants | Afghanistan | 92.4 /100 | #112 | Exceptional 83.2% |
| Immigrants | Albania | 91.8 /100 | #113 | Exceptional 83.2% |
| Assyrians/Chaldeans/Syriacs | 91.7 /100 | #114 | Exceptional 83.2% |
| Immigrants | Chile | 91.6 /100 | #115 | Exceptional 83.2% |
| Immigrants | Malaysia | 91.4 /100 | #116 | Exceptional 83.2% |
| Immigrants | China | 90.9 /100 | #117 | Exceptional 83.2% |
| Immigrants | Europe | 90.7 /100 | #118 | Exceptional 83.2% |
| Immigrants | Uruguay | 90.2 /100 | #119 | Exceptional 83.2% |
| Immigrants | Russia | 90.1 /100 | #120 | Exceptional 83.2% |
| Uruguayans | 89.4 /100 | #121 | Excellent 83.1% |
| Immigrants | Vietnam | 88.9 /100 | #122 | Excellent 83.1% |
| Tongans | 88.2 /100 | #123 | Excellent 83.1% |
| Bermudans | 88.0 /100 | #124 | Excellent 83.1% |
| Immigrants | Iran | 87.2 /100 | #125 | Excellent 83.1% |