Immigrants from Honduras vs Kiowa In Labor Force | Age 45-54
COMPARE
Immigrants from Honduras
Kiowa
In Labor Force | Age 45-54
In Labor Force | Age 45-54 Comparison
Immigrants from Honduras
Kiowa
81.4%
IN LABOR FORCE | AGE 45-54
0.0/ 100
METRIC RATING
268th/ 347
METRIC RANK
78.3%
IN LABOR FORCE | AGE 45-54
0.0/ 100
METRIC RATING
323rd/ 347
METRIC RANK
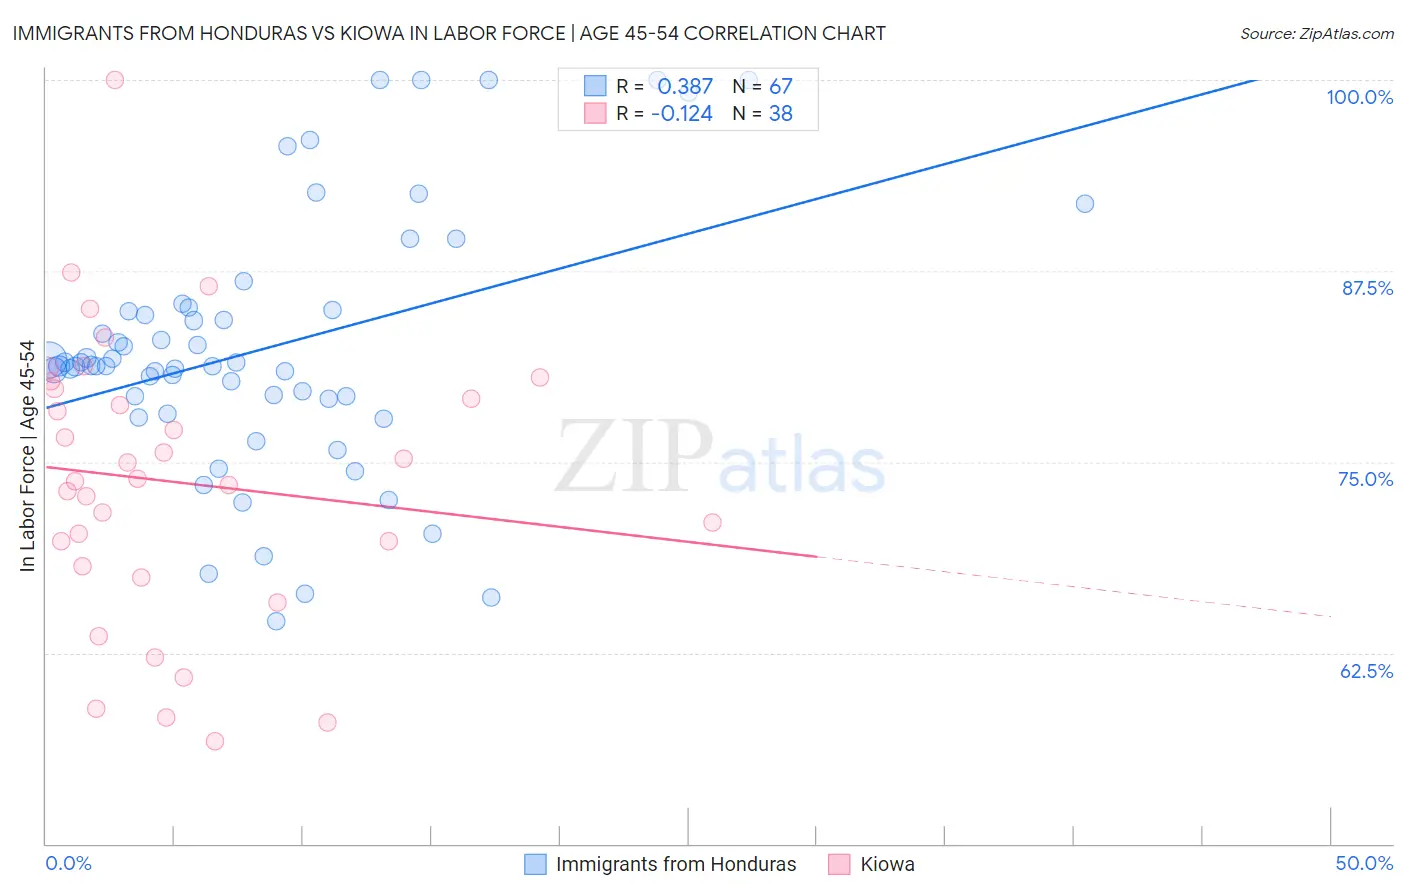
Immigrants from Honduras vs Kiowa In Labor Force | Age 45-54 Correlation Chart
The statistical analysis conducted on geographies consisting of 322,456,034 people shows a mild positive correlation between the proportion of Immigrants from Honduras and labor force participation rate among population between the ages 45 and 54 in the United States with a correlation coefficient (R) of 0.387 and weighted average of 81.4%. Similarly, the statistical analysis conducted on geographies consisting of 56,098,300 people shows a poor negative correlation between the proportion of Kiowa and labor force participation rate among population between the ages 45 and 54 in the United States with a correlation coefficient (R) of -0.124 and weighted average of 78.3%, a difference of 4.0%.
In Labor Force | Age 45-54 Correlation Summary
| Measurement | Immigrants from Honduras | Kiowa |
| Minimum | 64.6% | 56.7% |
| Maximum | 100.0% | 100.0% |
| Range | 35.4% | 43.3% |
| Mean | 82.4% | 73.7% |
| Median | 81.3% | 73.8% |
| Interquartile 25% (IQ1) | 79.1% | 68.2% |
| Interquartile 75% (IQ3) | 84.9% | 79.8% |
| Interquartile Range (IQR) | 5.8% | 11.6% |
| Standard Deviation (Sample) | 8.4% | 9.3% |
| Standard Deviation (Population) | 8.3% | 9.2% |
Similar Demographics by In Labor Force | Age 45-54
Demographics Similar to Immigrants from Honduras by In Labor Force | Age 45-54
In terms of in labor force | age 45-54, the demographic groups most similar to Immigrants from Honduras are West Indian (81.4%, a difference of 0.020%), Alsatian (81.3%, a difference of 0.020%), Immigrants from St. Vincent and the Grenadines (81.4%, a difference of 0.030%), Bangladeshi (81.3%, a difference of 0.050%), and Immigrants from Barbados (81.3%, a difference of 0.060%).
| Demographics | Rating | Rank | In Labor Force | Age 45-54 |
| Hawaiians | 0.1 /100 | #261 | Tragic 81.5% |
| Immigrants | Guyana | 0.1 /100 | #262 | Tragic 81.5% |
| Indonesians | 0.1 /100 | #263 | Tragic 81.5% |
| Immigrants | West Indies | 0.1 /100 | #264 | Tragic 81.5% |
| Hondurans | 0.1 /100 | #265 | Tragic 81.4% |
| Immigrants | St. Vincent and the Grenadines | 0.1 /100 | #266 | Tragic 81.4% |
| West Indians | 0.1 /100 | #267 | Tragic 81.4% |
| Immigrants | Honduras | 0.0 /100 | #268 | Tragic 81.4% |
| Alsatians | 0.0 /100 | #269 | Tragic 81.3% |
| Bangladeshis | 0.0 /100 | #270 | Tragic 81.3% |
| Immigrants | Barbados | 0.0 /100 | #271 | Tragic 81.3% |
| Spanish | 0.0 /100 | #272 | Tragic 81.3% |
| Chippewa | 0.0 /100 | #273 | Tragic 81.3% |
| British West Indians | 0.0 /100 | #274 | Tragic 81.2% |
| Immigrants | Nonimmigrants | 0.0 /100 | #275 | Tragic 81.2% |
Demographics Similar to Kiowa by In Labor Force | Age 45-54
In terms of in labor force | age 45-54, the demographic groups most similar to Kiowa are Dutch West Indian (78.2%, a difference of 0.020%), Crow (78.3%, a difference of 0.080%), Choctaw (78.2%, a difference of 0.11%), Seminole (78.1%, a difference of 0.16%), and Cajun (78.1%, a difference of 0.16%).
| Demographics | Rating | Rank | In Labor Force | Age 45-54 |
| Shoshone | 0.0 /100 | #316 | Tragic 79.3% |
| Comanche | 0.0 /100 | #317 | Tragic 79.2% |
| Chickasaw | 0.0 /100 | #318 | Tragic 79.0% |
| Cherokee | 0.0 /100 | #319 | Tragic 79.0% |
| Yaqui | 0.0 /100 | #320 | Tragic 78.9% |
| Yup'ik | 0.0 /100 | #321 | Tragic 78.6% |
| Crow | 0.0 /100 | #322 | Tragic 78.3% |
| Kiowa | 0.0 /100 | #323 | Tragic 78.3% |
| Dutch West Indians | 0.0 /100 | #324 | Tragic 78.2% |
| Choctaw | 0.0 /100 | #325 | Tragic 78.2% |
| Seminole | 0.0 /100 | #326 | Tragic 78.1% |
| Cajuns | 0.0 /100 | #327 | Tragic 78.1% |
| Sioux | 0.0 /100 | #328 | Tragic 78.0% |
| Creek | 0.0 /100 | #329 | Tragic 77.7% |
| Cheyenne | 0.0 /100 | #330 | Tragic 77.6% |