Nigerian vs Immigrants from Senegal In Labor Force | Age 30-34
COMPARE
Nigerian
Immigrants from Senegal
In Labor Force | Age 30-34
In Labor Force | Age 30-34 Comparison
Nigerians
Immigrants from Senegal
84.5%
IN LABOR FORCE | AGE 30-34
28.9/ 100
METRIC RATING
189th/ 347
METRIC RANK
84.8%
IN LABOR FORCE | AGE 30-34
74.0/ 100
METRIC RATING
151st/ 347
METRIC RANK
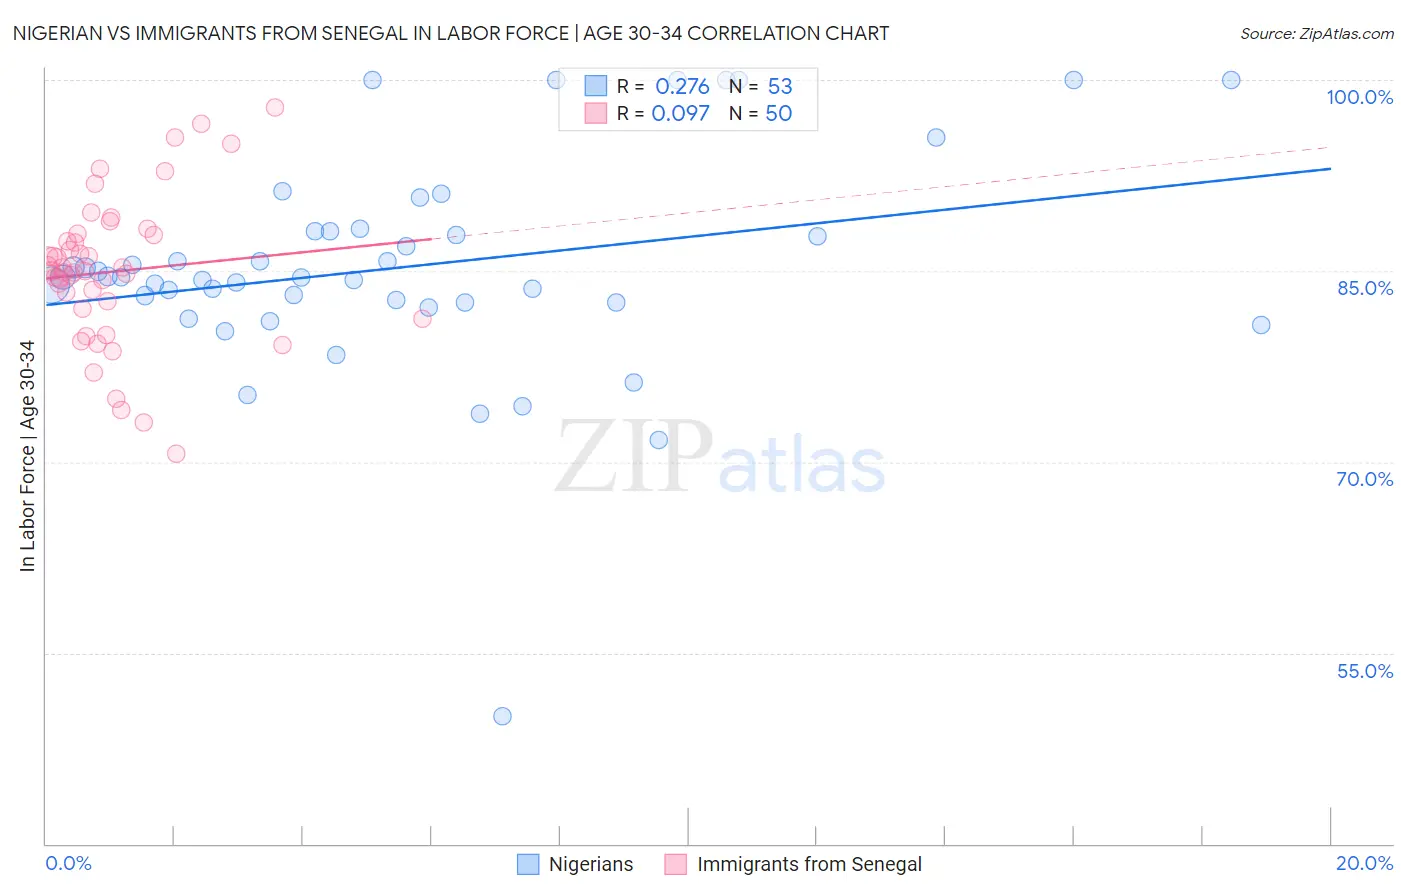
Nigerian vs Immigrants from Senegal In Labor Force | Age 30-34 Correlation Chart
The statistical analysis conducted on geographies consisting of 332,575,252 people shows a weak positive correlation between the proportion of Nigerians and labor force participation rate among population between the ages 30 and 34 in the United States with a correlation coefficient (R) of 0.276 and weighted average of 84.5%. Similarly, the statistical analysis conducted on geographies consisting of 90,111,000 people shows a slight positive correlation between the proportion of Immigrants from Senegal and labor force participation rate among population between the ages 30 and 34 in the United States with a correlation coefficient (R) of 0.097 and weighted average of 84.8%, a difference of 0.34%.
In Labor Force | Age 30-34 Correlation Summary
| Measurement | Nigerian | Immigrants from Senegal |
| Minimum | 50.0% | 70.6% |
| Maximum | 100.0% | 97.8% |
| Range | 50.0% | 27.2% |
| Mean | 85.3% | 84.9% |
| Median | 84.5% | 84.9% |
| Interquartile 25% (IQ1) | 82.5% | 82.1% |
| Interquartile 75% (IQ3) | 88.1% | 87.8% |
| Interquartile Range (IQR) | 5.6% | 5.7% |
| Standard Deviation (Sample) | 8.6% | 5.8% |
| Standard Deviation (Population) | 8.5% | 5.7% |
Similar Demographics by In Labor Force | Age 30-34
Demographics Similar to Nigerians by In Labor Force | Age 30-34
In terms of in labor force | age 30-34, the demographic groups most similar to Nigerians are Taiwanese (84.6%, a difference of 0.0%), Immigrants from Congo (84.6%, a difference of 0.010%), Costa Rican (84.6%, a difference of 0.010%), Immigrants from Philippines (84.6%, a difference of 0.020%), and Immigrants from Zaire (84.5%, a difference of 0.030%).
| Demographics | Rating | Rank | In Labor Force | Age 30-34 |
| Barbadians | 36.7 /100 | #182 | Fair 84.6% |
| Immigrants | Canada | 35.0 /100 | #183 | Fair 84.6% |
| Immigrants | North America | 33.3 /100 | #184 | Fair 84.6% |
| Immigrants | Philippines | 31.5 /100 | #185 | Fair 84.6% |
| Immigrants | Congo | 29.7 /100 | #186 | Fair 84.6% |
| Costa Ricans | 29.6 /100 | #187 | Fair 84.6% |
| Taiwanese | 29.4 /100 | #188 | Fair 84.6% |
| Nigerians | 28.9 /100 | #189 | Fair 84.5% |
| Immigrants | Zaire | 25.8 /100 | #190 | Fair 84.5% |
| Hungarians | 24.8 /100 | #191 | Fair 84.5% |
| Scandinavians | 24.7 /100 | #192 | Fair 84.5% |
| Immigrants | Costa Rica | 23.9 /100 | #193 | Fair 84.5% |
| Immigrants | Afghanistan | 23.5 /100 | #194 | Fair 84.5% |
| Koreans | 23.2 /100 | #195 | Fair 84.5% |
| British | 22.9 /100 | #196 | Fair 84.5% |
Demographics Similar to Immigrants from Senegal by In Labor Force | Age 30-34
In terms of in labor force | age 30-34, the demographic groups most similar to Immigrants from Senegal are Romanian (84.8%, a difference of 0.0%), Immigrants from Ukraine (84.8%, a difference of 0.010%), German (84.8%, a difference of 0.010%), Immigrants from Saudi Arabia (84.9%, a difference of 0.020%), and Immigrants from Colombia (84.9%, a difference of 0.020%).
| Demographics | Rating | Rank | In Labor Force | Age 30-34 |
| Uruguayans | 78.5 /100 | #144 | Good 84.9% |
| Palestinians | 77.7 /100 | #145 | Good 84.9% |
| Immigrants | Saudi Arabia | 76.6 /100 | #146 | Good 84.9% |
| Immigrants | Colombia | 76.3 /100 | #147 | Good 84.9% |
| Immigrants | Pakistan | 76.2 /100 | #148 | Good 84.9% |
| Immigrants | Ukraine | 75.1 /100 | #149 | Good 84.8% |
| Germans | 75.1 /100 | #150 | Good 84.8% |
| Immigrants | Senegal | 74.0 /100 | #151 | Good 84.8% |
| Romanians | 73.5 /100 | #152 | Good 84.8% |
| Syrians | 70.1 /100 | #153 | Good 84.8% |
| Northern Europeans | 70.0 /100 | #154 | Good 84.8% |
| Immigrants | Sudan | 69.5 /100 | #155 | Good 84.8% |
| French Canadians | 67.3 /100 | #156 | Good 84.8% |
| Peruvians | 65.9 /100 | #157 | Good 84.8% |
| Immigrants | Armenia | 64.7 /100 | #158 | Good 84.8% |