Immigrants from Guyana vs French In Labor Force | Age > 16
COMPARE
Immigrants from Guyana
French
In Labor Force | Age > 16
In Labor Force | Age > 16 Comparison
Immigrants from Guyana
French
64.0%
IN LABOR FORCE | AGE > 16
0.2/ 100
METRIC RATING
282nd/ 347
METRIC RANK
63.9%
IN LABOR FORCE | AGE > 16
0.1/ 100
METRIC RATING
284th/ 347
METRIC RANK
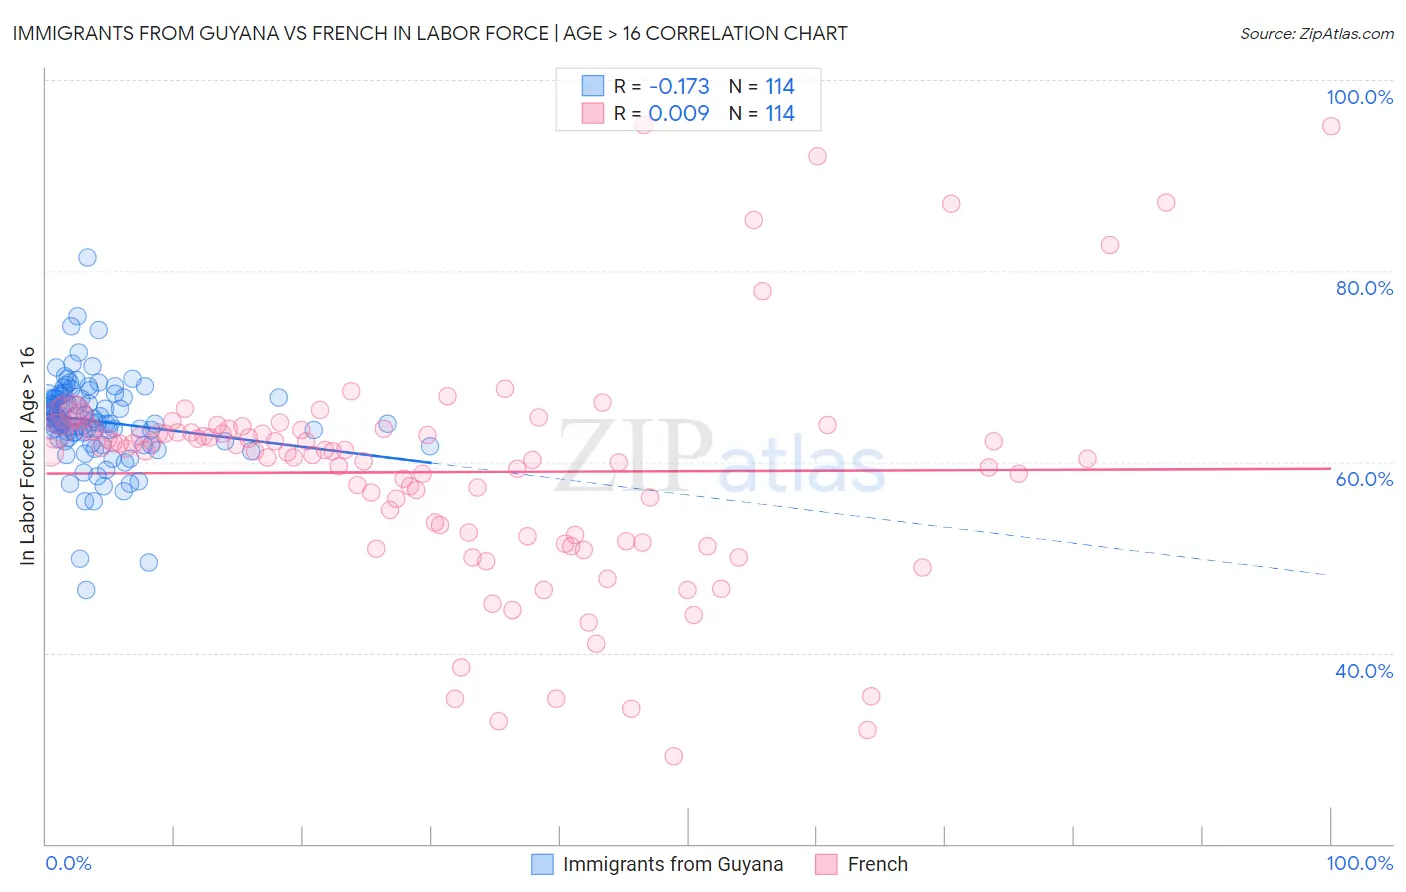
Immigrants from Guyana vs French In Labor Force | Age > 16 Correlation Chart
The statistical analysis conducted on geographies consisting of 183,746,738 people shows a poor negative correlation between the proportion of Immigrants from Guyana and labor force participation rate among population ages 16 and over in the United States with a correlation coefficient (R) of -0.173 and weighted average of 64.0%. Similarly, the statistical analysis conducted on geographies consisting of 572,429,642 people shows no correlation between the proportion of French and labor force participation rate among population ages 16 and over in the United States with a correlation coefficient (R) of 0.009 and weighted average of 63.9%, a difference of 0.060%.
In Labor Force | Age > 16 Correlation Summary
| Measurement | Immigrants from Guyana | French |
| Minimum | 46.6% | 29.1% |
| Maximum | 81.4% | 95.3% |
| Range | 34.8% | 66.2% |
| Mean | 64.3% | 58.9% |
| Median | 64.3% | 61.1% |
| Interquartile 25% (IQ1) | 62.5% | 52.2% |
| Interquartile 75% (IQ3) | 66.7% | 63.3% |
| Interquartile Range (IQR) | 4.2% | 11.1% |
| Standard Deviation (Sample) | 4.6% | 11.8% |
| Standard Deviation (Population) | 4.6% | 11.8% |
Demographics Similar to Immigrants from Guyana and French by In Labor Force | Age > 16
In terms of in labor force | age > 16, the demographic groups most similar to Immigrants from Guyana are Immigrants from Germany (63.9%, a difference of 0.040%), Immigrants from St. Vincent and the Grenadines (64.0%, a difference of 0.080%), French Canadian (64.0%, a difference of 0.080%), Welsh (64.0%, a difference of 0.090%), and Slovak (63.9%, a difference of 0.090%). Similarly, the demographic groups most similar to French are Immigrants from Germany (63.9%, a difference of 0.010%), Slovak (63.9%, a difference of 0.030%), Immigrants from Austria (63.9%, a difference of 0.060%), Scottish (63.9%, a difference of 0.060%), and Spanish (63.9%, a difference of 0.10%).
| Demographics | Rating | Rank | In Labor Force | Age > 16 |
| Hmong | 0.3 /100 | #273 | Tragic 64.1% |
| Immigrants | Cuba | 0.3 /100 | #274 | Tragic 64.1% |
| Mexicans | 0.3 /100 | #275 | Tragic 64.1% |
| French American Indians | 0.3 /100 | #276 | Tragic 64.1% |
| Immigrants | Bahamas | 0.3 /100 | #277 | Tragic 64.0% |
| Assyrians/Chaldeans/Syriacs | 0.3 /100 | #278 | Tragic 64.0% |
| Welsh | 0.2 /100 | #279 | Tragic 64.0% |
| Immigrants | St. Vincent and the Grenadines | 0.2 /100 | #280 | Tragic 64.0% |
| French Canadians | 0.2 /100 | #281 | Tragic 64.0% |
| Immigrants | Guyana | 0.2 /100 | #282 | Tragic 64.0% |
| Immigrants | Germany | 0.1 /100 | #283 | Tragic 63.9% |
| French | 0.1 /100 | #284 | Tragic 63.9% |
| Slovaks | 0.1 /100 | #285 | Tragic 63.9% |
| Immigrants | Austria | 0.1 /100 | #286 | Tragic 63.9% |
| Scottish | 0.1 /100 | #287 | Tragic 63.9% |
| Spanish | 0.1 /100 | #288 | Tragic 63.9% |
| Celtics | 0.1 /100 | #289 | Tragic 63.8% |
| Hungarians | 0.1 /100 | #290 | Tragic 63.8% |
| Nepalese | 0.1 /100 | #291 | Tragic 63.8% |
| Spanish American Indians | 0.1 /100 | #292 | Tragic 63.8% |
| English | 0.1 /100 | #293 | Tragic 63.7% |