Immigrants from Guyana vs Kenyan In Labor Force | Age 20-24
COMPARE
Immigrants from Guyana
Kenyan
In Labor Force | Age 20-24
In Labor Force | Age 20-24 Comparison
Immigrants from Guyana
Kenyans
69.3%
IN LABOR FORCE | AGE 20-24
0.0/ 100
METRIC RATING
336th/ 347
METRIC RANK
77.0%
IN LABOR FORCE | AGE 20-24
99.9/ 100
METRIC RATING
60th/ 347
METRIC RANK
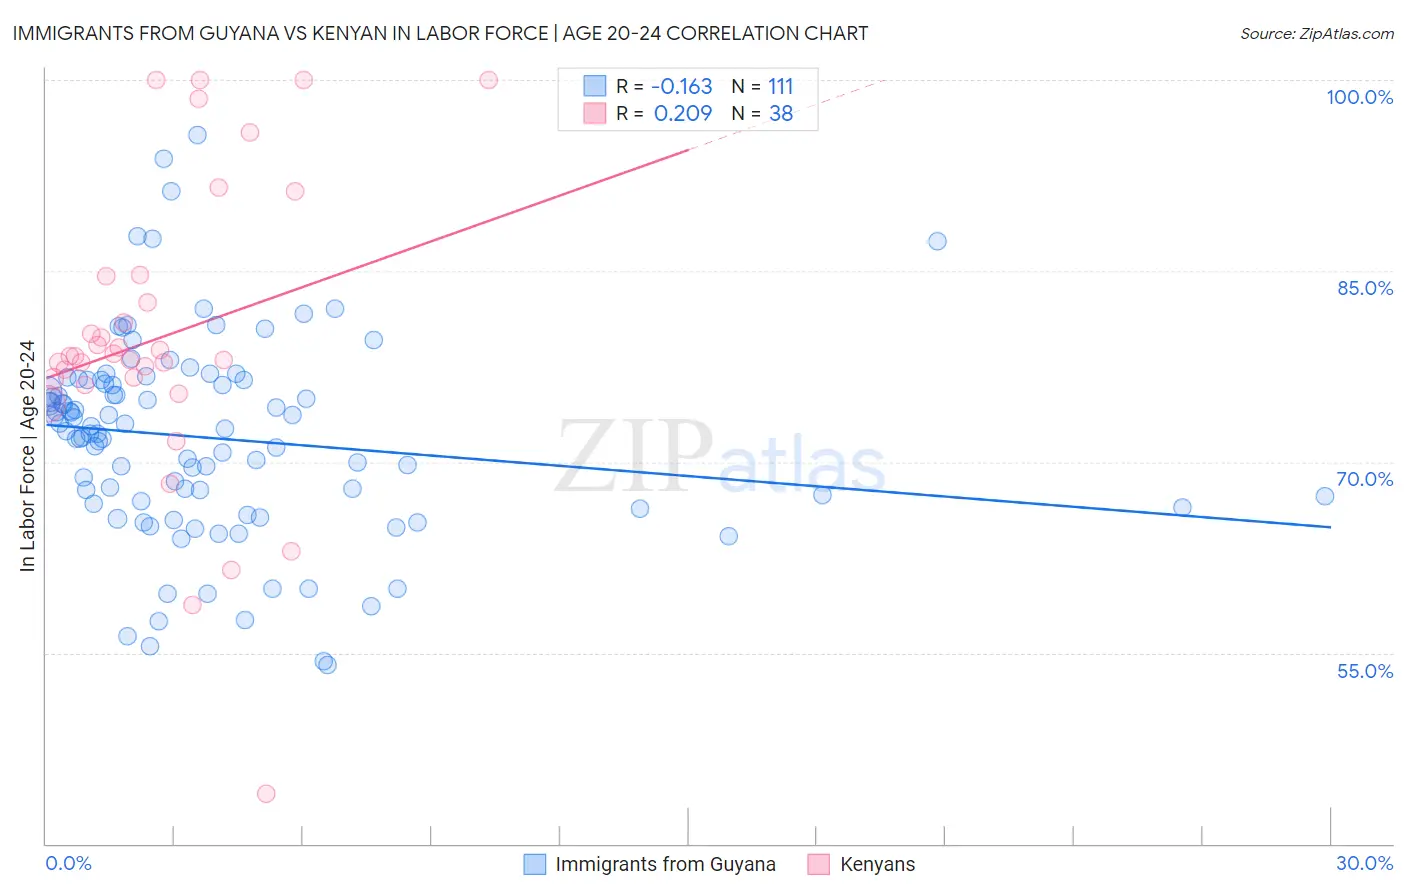
Immigrants from Guyana vs Kenyan In Labor Force | Age 20-24 Correlation Chart
The statistical analysis conducted on geographies consisting of 183,673,917 people shows a poor negative correlation between the proportion of Immigrants from Guyana and labor force participation rate among population between the ages 20 and 24 in the United States with a correlation coefficient (R) of -0.163 and weighted average of 69.3%. Similarly, the statistical analysis conducted on geographies consisting of 168,238,986 people shows a weak positive correlation between the proportion of Kenyans and labor force participation rate among population between the ages 20 and 24 in the United States with a correlation coefficient (R) of 0.209 and weighted average of 77.0%, a difference of 11.2%.
In Labor Force | Age 20-24 Correlation Summary
| Measurement | Immigrants from Guyana | Kenyan |
| Minimum | 54.0% | 43.9% |
| Maximum | 95.7% | 100.0% |
| Range | 41.7% | 56.1% |
| Mean | 71.9% | 79.8% |
| Median | 72.4% | 78.3% |
| Interquartile 25% (IQ1) | 66.7% | 76.5% |
| Interquartile 75% (IQ3) | 76.4% | 84.6% |
| Interquartile Range (IQR) | 9.7% | 8.0% |
| Standard Deviation (Sample) | 7.9% | 11.9% |
| Standard Deviation (Population) | 7.8% | 11.7% |
Similar Demographics by In Labor Force | Age 20-24
Demographics Similar to Immigrants from Guyana by In Labor Force | Age 20-24
In terms of in labor force | age 20-24, the demographic groups most similar to Immigrants from Guyana are Guyanese (69.2%, a difference of 0.13%), Pima (69.0%, a difference of 0.39%), Immigrants from Yemen (68.9%, a difference of 0.52%), Immigrants from Barbados (69.7%, a difference of 0.66%), and Menominee (68.7%, a difference of 0.83%).
| Demographics | Rating | Rank | In Labor Force | Age 20-24 |
| Yup'ik | 0.0 /100 | #329 | Tragic 70.9% |
| Vietnamese | 0.0 /100 | #330 | Tragic 70.6% |
| Immigrants | Bangladesh | 0.0 /100 | #331 | Tragic 70.6% |
| Immigrants | Uzbekistan | 0.0 /100 | #332 | Tragic 70.4% |
| Yuman | 0.0 /100 | #333 | Tragic 70.3% |
| British West Indians | 0.0 /100 | #334 | Tragic 70.0% |
| Immigrants | Barbados | 0.0 /100 | #335 | Tragic 69.7% |
| Immigrants | Guyana | 0.0 /100 | #336 | Tragic 69.3% |
| Guyanese | 0.0 /100 | #337 | Tragic 69.2% |
| Pima | 0.0 /100 | #338 | Tragic 69.0% |
| Immigrants | Yemen | 0.0 /100 | #339 | Tragic 68.9% |
| Menominee | 0.0 /100 | #340 | Tragic 68.7% |
| Tohono O'odham | 0.0 /100 | #341 | Tragic 68.6% |
| Immigrants | St. Vincent and the Grenadines | 0.0 /100 | #342 | Tragic 68.4% |
| Puerto Ricans | 0.0 /100 | #343 | Tragic 68.3% |
Demographics Similar to Kenyans by In Labor Force | Age 20-24
In terms of in labor force | age 20-24, the demographic groups most similar to Kenyans are Scotch-Irish (77.0%, a difference of 0.040%), Immigrants from Eritrea (77.0%, a difference of 0.050%), Hawaiian (77.0%, a difference of 0.060%), Immigrants from Kenya (77.0%, a difference of 0.060%), and Lithuanian (77.0%, a difference of 0.060%).
| Demographics | Rating | Rank | In Labor Force | Age 20-24 |
| Immigrants | Azores | 100.0 /100 | #53 | Exceptional 77.2% |
| Celtics | 99.9 /100 | #54 | Exceptional 77.1% |
| Immigrants | Liberia | 99.9 /100 | #55 | Exceptional 77.1% |
| Europeans | 99.9 /100 | #56 | Exceptional 77.1% |
| Chippewa | 99.9 /100 | #57 | Exceptional 77.1% |
| Hawaiians | 99.9 /100 | #58 | Exceptional 77.0% |
| Scotch-Irish | 99.9 /100 | #59 | Exceptional 77.0% |
| Kenyans | 99.9 /100 | #60 | Exceptional 77.0% |
| Immigrants | Eritrea | 99.9 /100 | #61 | Exceptional 77.0% |
| Immigrants | Kenya | 99.9 /100 | #62 | Exceptional 77.0% |
| Lithuanians | 99.9 /100 | #63 | Exceptional 77.0% |
| Whites/Caucasians | 99.9 /100 | #64 | Exceptional 76.9% |
| Crow | 99.9 /100 | #65 | Exceptional 76.9% |
| Icelanders | 99.9 /100 | #66 | Exceptional 76.9% |
| Slavs | 99.9 /100 | #67 | Exceptional 76.9% |