Immigrants from Belize vs Immigrants from Zimbabwe In Labor Force | Age 25-29

COMPARE

Immigrants from Belize
Race
Ancestry
AfghanAfricanAlaska NativeAlaskan AthabascanAlbanianAleutAlsatianAmericanApacheArabArapahoArgentineanArmenianAssyrian/Chaldean/SyriacAustralianAustrianBahamianBangladeshiBarbadianBasqueBelgianBelizeanBermudanBhutaneseBlackfeetBolivianBrazilianBritishBritish West IndianBulgarianBurmeseCajunCambodianCanadianCape VerdeanCarpatho RusynCelticCentral AmericanCentral American IndianCherokeeCheyenneChickasawChileanChineseChippewaChoctawColombianColvilleComancheCosta RicanCreeCreekCroatianCrowCubanCypriotCzechCzechoslovakianDanishDelawareDominicanDutchDutch West IndianEastern EuropeanEcuadorianEgyptianEnglishEstonianEthiopianEuropeanFijianFilipinoFinnishFrenchFrench American IndianFrench CanadianGermanGerman RussianGhanaianGreekGuamanian/ChamorroGuatemalanGuyaneseHaitianHmongHonduranHopiHoumaHungarianIcelanderIndian (Asian)IndonesianInupiatIranianIraqiIrishIroquoisIsraeliItalianJamaicanJapaneseJordanianKenyanKiowaKoreanLaotianLatvianLebaneseLiberianLithuanianLumbeeLuxembourgerMacedonianMalaysianMalteseMarshalleseMenomineeMexicanMexican American IndianMongolianMoroccanNative HawaiianNavajoNepaleseNew ZealanderNicaraguanNigerianNorthern EuropeanNorwegianOkinawanOsageOttawaPaiutePakistaniPalestinianPanamanianParaguayanPennsylvania GermanPeruvianPimaPolishPortuguesePotawatomiPuebloPuerto RicanPuget Sound SalishRomanianRussianSalvadoranSamoanScandinavianScotch-IrishScottishSeminoleSenegaleseSerbianShoshoneSierra LeoneanSiouxSlavicSlovakSloveneSomaliSouth AfricanSouth AmericanSouth American IndianSoviet UnionSpaniardSpanishSpanish AmericanSpanish American IndianSri LankanSubsaharan AfricanSudaneseSwedishSwissSyrianTaiwaneseThaiTlingit-HaidaTohono O'OdhamTonganTrinidadian and TobagonianTsimshianTurkishU.S. Virgin IslanderUgandanUkrainianUruguayanUteVenezuelanVietnameseWelshWest IndianYakamaYaquiYugoslavianYumanYup'ikZimbabwean
Immigration
NonimmigrantsImmigrantsAfghanistanAfricaAlbaniaArgentinaArmeniaAsiaAustraliaAustriaBahamasBangladeshBarbadosBelarusBelgiumBelizeBoliviaBosnia and HerzegovinaBrazilBulgariaBurma/MyanmarCabo VerdeCambodiaCameroonCanadaCaribbeanCentral AmericaChileChinaColombiaCongoCosta RicaCroatiaCubaCzechoslovakiaDenmarkDominicaDominican RepublicEastern AfricaEastern AsiaEastern EuropeEcuadorEgyptEl SalvadorEnglandEritreaEthiopiaEuropeFijiFranceGermanyGhanaGreeceGrenadaGuatemalaGuyanaHaitiHondurasHong KongHungaryIndiaIndonesiaIranIraqIrelandIsraelItalyJamaicaJapanJordanKazakhstanKenyaKoreaKuwaitLaosLatin AmericaLatviaLebanonLiberiaLithuaniaMalaysiaMexicoMicronesiaMiddle AfricaMoldovaMoroccoNepalNetherlandsNicaraguaNigeriaNorth AmericaNorth MacedoniaNorthern AfricaNorthern EuropeNorwayOceaniaPakistanPanamaPeruPhilippinesPolandPortugalRomaniaRussiaSaudi ArabiaScotlandSenegalSerbiaSierra LeoneSingaporeSomaliaSouth AfricaSouth AmericaSouth Central AsiaSouth Eastern AsiaSouthern EuropeSpainSri LankaSt. Vincent and the GrenadinesSudanSwedenSwitzerlandSyriaTaiwanThailandTrinidad and TobagoTurkeyUgandaUkraineUruguayUzbekistanVenezuelaVietnamWest IndiesWestern AfricaWestern AsiaWestern EuropeYemenZaireAzores
Immigrants from Zimbabwe
Race
Ancestry
AfghanAfricanAlaska NativeAlaskan AthabascanAlbanianAleutAlsatianAmericanApacheArabArapahoArgentineanArmenianAssyrian/Chaldean/SyriacAustralianAustrianBahamianBangladeshiBarbadianBasqueBelgianBelizeanBermudanBhutaneseBlackfeetBolivianBrazilianBritishBritish West IndianBulgarianBurmeseCajunCambodianCanadianCape VerdeanCarpatho RusynCelticCentral AmericanCentral American IndianCherokeeCheyenneChickasawChileanChineseChippewaChoctawColombianColvilleComancheCosta RicanCreeCreekCroatianCrowCubanCypriotCzechCzechoslovakianDanishDelawareDominicanDutchDutch West IndianEastern EuropeanEcuadorianEgyptianEnglishEstonianEthiopianEuropeanFijianFilipinoFinnishFrenchFrench American IndianFrench CanadianGermanGerman RussianGhanaianGreekGuamanian/ChamorroGuatemalanGuyaneseHaitianHmongHonduranHopiHoumaHungarianIcelanderIndian (Asian)IndonesianInupiatIranianIraqiIrishIroquoisIsraeliItalianJamaicanJapaneseJordanianKenyanKiowaKoreanLaotianLatvianLebaneseLiberianLithuanianLumbeeLuxembourgerMacedonianMalaysianMalteseMarshalleseMenomineeMexicanMexican American IndianMongolianMoroccanNative HawaiianNavajoNepaleseNew ZealanderNicaraguanNigerianNorthern EuropeanNorwegianOkinawanOsageOttawaPaiutePakistaniPalestinianPanamanianParaguayanPennsylvania GermanPeruvianPimaPolishPortuguesePotawatomiPuebloPuerto RicanPuget Sound SalishRomanianRussianSalvadoranSamoanScandinavianScotch-IrishScottishSeminoleSenegaleseSerbianShoshoneSierra LeoneanSiouxSlavicSlovakSloveneSomaliSouth AfricanSouth AmericanSouth American IndianSoviet UnionSpaniardSpanishSpanish AmericanSpanish American IndianSri LankanSubsaharan AfricanSudaneseSwedishSwissSyrianTaiwaneseThaiTlingit-HaidaTohono O'OdhamTonganTrinidadian and TobagonianTsimshianTurkishU.S. Virgin IslanderUgandanUkrainianUruguayanUteVenezuelanVietnameseWelshWest IndianYakamaYaquiYugoslavianYumanYup'ikZimbabwean
Immigration
NonimmigrantsImmigrantsAfghanistanAfricaAlbaniaArgentinaArmeniaAsiaAustraliaAustriaBahamasBangladeshBarbadosBelarusBelgiumBoliviaBosnia and HerzegovinaBrazilBulgariaBurma/MyanmarCabo VerdeCambodiaCameroonCanadaCaribbeanCentral AmericaChileChinaColombiaCongoCosta RicaCroatiaCubaCzechoslovakiaDenmarkDominicaDominican RepublicEastern AfricaEastern AsiaEastern EuropeEcuadorEgyptEl SalvadorEnglandEritreaEthiopiaEuropeFijiFranceGermanyGhanaGreeceGrenadaGuatemalaGuyanaHaitiHondurasHong KongHungaryIndiaIndonesiaIranIraqIrelandIsraelItalyJamaicaJapanJordanKazakhstanKenyaKoreaKuwaitLaosLatin AmericaLatviaLebanonLiberiaLithuaniaMalaysiaMexicoMicronesiaMiddle AfricaMoldovaMoroccoNepalNetherlandsNicaraguaNigeriaNorth AmericaNorth MacedoniaNorthern AfricaNorthern EuropeNorwayOceaniaPakistanPanamaPeruPhilippinesPolandPortugalRomaniaRussiaSaudi ArabiaScotlandSenegalSerbiaSierra LeoneSingaporeSomaliaSouth AfricaSouth AmericaSouth Central AsiaSouth Eastern AsiaSouthern EuropeSpainSri LankaSt. Vincent and the GrenadinesSudanSwedenSwitzerlandSyriaTaiwanThailandTrinidad and TobagoTurkeyUgandaUkraineUruguayUzbekistanVenezuelaVietnamWest IndiesWestern AfricaWestern AsiaWestern EuropeYemenZaireZimbabweAzores
In Labor Force | Age 25-29
Income
Poverty
Unemployment
Labor Participation
Family Structure
Vehicle Availability
Education Level
Disability

In Labor Force | Age 25-29 Comparison

Immigrants from Belize

Immigrants from Zimbabwe

Tragic
Exceptional
82.8%
IN LABOR FORCE | AGE 25-29
0.0/ 100
METRIC RATING
302nd/ 347
METRIC RANK
85.2%
IN LABOR FORCE | AGE 25-29
97.6/ 100
METRIC RATING
80th/ 347
METRIC RANK

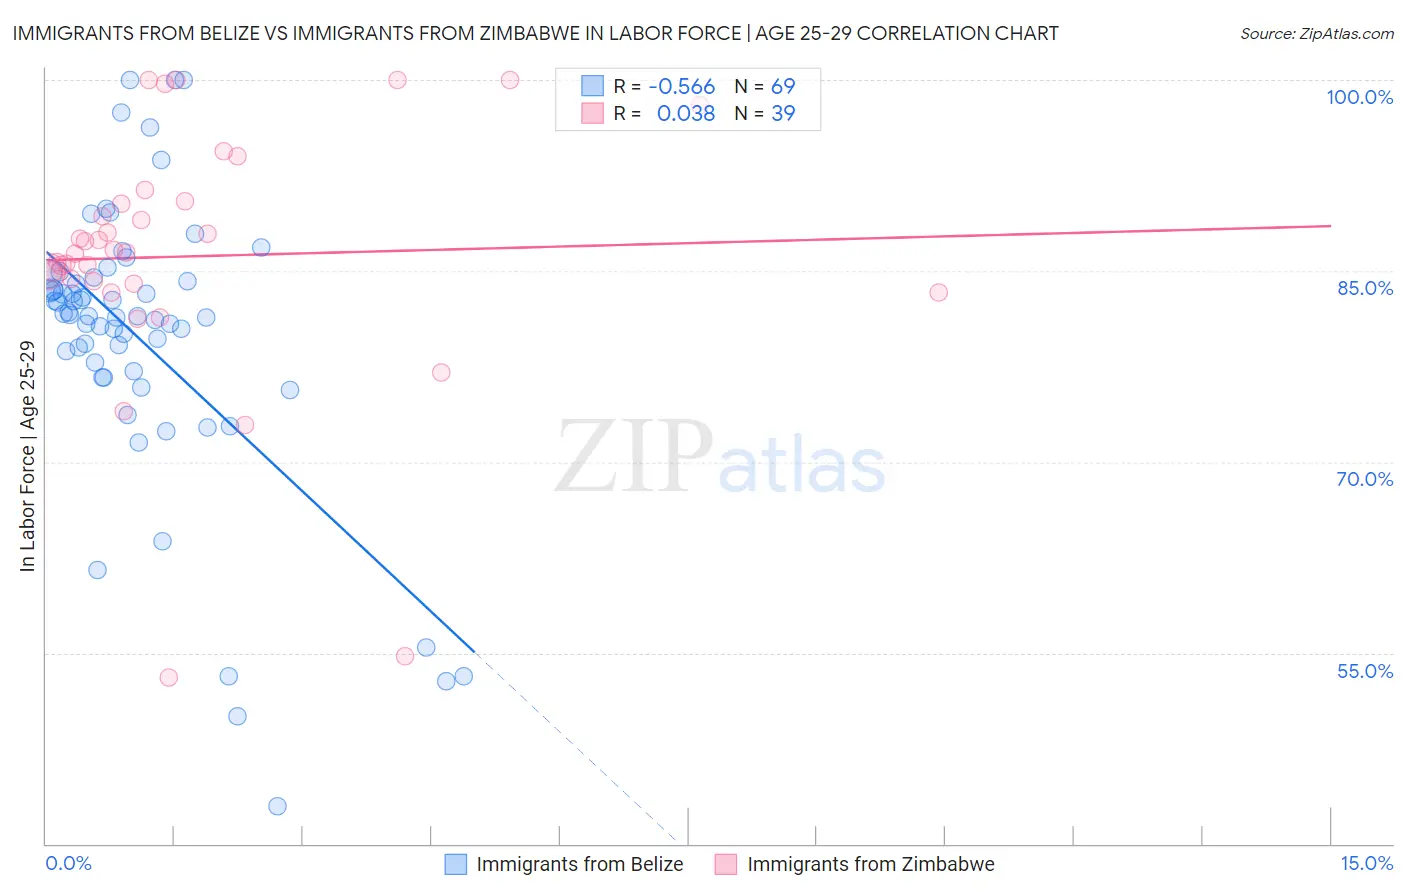
Immigrants from Belize vs Immigrants from Zimbabwe In Labor Force | Age 25-29 Correlation Chart

The statistical analysis conducted on geographies consisting of 130,310,210 people shows a substantial negative correlation between the proportion of Immigrants from Belize and labor force participation rate among population between the ages 25 and 29 in the United States with a correlation coefficient (R) of -0.566 and weighted average of 82.8%. Similarly, the statistical analysis conducted on geographies consisting of 117,801,393 people shows no correlation between the proportion of Immigrants from Zimbabwe and labor force participation rate among population between the ages 25 and 29 in the United States with a correlation coefficient (R) of 0.038 and weighted average of 85.2%, a difference of 2.9%.
Immigrants from Belize vs Immigrants from Zimbabwe In Labor Force | Age 25-29

In Labor Force | Age 25-29 Correlation Summary

MeasurementImmigrants from BelizeImmigrants from Zimbabwe
Minimum42.9%53.1%
Maximum100.0%100.0%
Range57.1%46.9%
Mean79.6%86.2%
Median81.5%86.4%
Interquartile 25% (IQ1)76.9%84.0%
Interquartile 75% (IQ3)84.3%90.5%
Interquartile Range (IQR)7.5%6.5%
Standard Deviation (Sample)11.3%10.1%
Standard Deviation (Population)11.2%10.0%

Similar Demographics by In Labor Force | Age 25-29

Demographics Similar to Immigrants from Belize by In Labor Force | Age 25-29

In terms of in labor force | age 25-29, the demographic groups most similar to Immigrants from Belize are Immigrants from Grenada (82.8%, a difference of 0.010%), Vietnamese (82.8%, a difference of 0.030%), Spanish American Indian (82.9%, a difference of 0.10%), Fijian (82.9%, a difference of 0.11%), and Native Hawaiian (82.9%, a difference of 0.12%).
DemographicsRating | RankIn Labor Force | Age 25-29
Chippewa
0.0
/100
|
#295
Tragic
82.9%
Immigrants | Nicaragua
0.0
/100
|
#296
Tragic
82.9%
Potawatomi
0.0
/100
|
#297
Tragic
82.9%
Native Hawaiians
0.0
/100
|
#298
Tragic
82.9%
Fijians
0.0
/100
|
#299
Tragic
82.9%
Spanish American Indians
0.0
/100
|
#300
Tragic
82.9%
Vietnamese
0.0
/100
|
#301
Tragic
82.8%
Immigrants | Belize
0.0
/100
|
#302
Tragic
82.8%
Immigrants | Grenada
0.0
/100
|
#303
Tragic
82.8%
Immigrants | St. Vincent and the Grenadines
0.0
/100
|
#304
Tragic
82.7%
Blacks/African Americans
0.0
/100
|
#305
Tragic
82.6%
Blackfeet
0.0
/100
|
#306
Tragic
82.6%
Cajuns
0.0
/100
|
#307
Tragic
82.5%
Central American Indians
0.0
/100
|
#308
Tragic
82.4%
Immigrants | Central America
0.0
/100
|
#309
Tragic
82.4%

Demographics Similar to Immigrants from Zimbabwe by In Labor Force | Age 25-29

In terms of in labor force | age 25-29, the demographic groups most similar to Immigrants from Zimbabwe are Immigrants from Northern Africa (85.2%, a difference of 0.0%), Immigrants from Egypt (85.2%, a difference of 0.010%), Immigrants from Northern Europe (85.2%, a difference of 0.020%), Immigrants from South Central Asia (85.2%, a difference of 0.030%), and German (85.3%, a difference of 0.040%).
DemographicsRating | RankIn Labor Force | Age 25-29
Russians
98.8
/100
|
#73
Exceptional
85.3%
Soviet Union
98.5
/100
|
#74
Exceptional
85.3%
Brazilians
98.3
/100
|
#75
Exceptional
85.3%
Germans
98.1
/100
|
#76
Exceptional
85.3%
Immigrants | South Central Asia
97.9
/100
|
#77
Exceptional
85.2%
Immigrants | Egypt
97.7
/100
|
#78
Exceptional
85.2%
Immigrants | Northern Africa
97.6
/100
|
#79
Exceptional
85.2%
Immigrants | Zimbabwe
97.6
/100
|
#80
Exceptional
85.2%
Immigrants | Northern Europe
97.2
/100
|
#81
Exceptional
85.2%
Okinawans
97.0
/100
|
#82
Exceptional
85.2%
Immigrants | Europe
96.8
/100
|
#83
Exceptional
85.2%
Immigrants | Eastern Europe
96.8
/100
|
#84
Exceptional
85.2%
Immigrants | Africa
96.7
/100
|
#85
Exceptional
85.2%
Ukrainians
96.7
/100
|
#86
Exceptional
85.2%
French Canadians
96.5
/100
|
#87
Exceptional
85.2%