Immigrants from Greece vs Pueblo In Labor Force | Age 45-54
COMPARE
Immigrants from Greece
Pueblo
In Labor Force | Age 45-54
In Labor Force | Age 45-54 Comparison
Immigrants from Greece
Pueblo
83.6%
IN LABOR FORCE | AGE 45-54
98.8/ 100
METRIC RATING
50th/ 347
METRIC RANK
75.5%
IN LABOR FORCE | AGE 45-54
0.0/ 100
METRIC RATING
341st/ 347
METRIC RANK
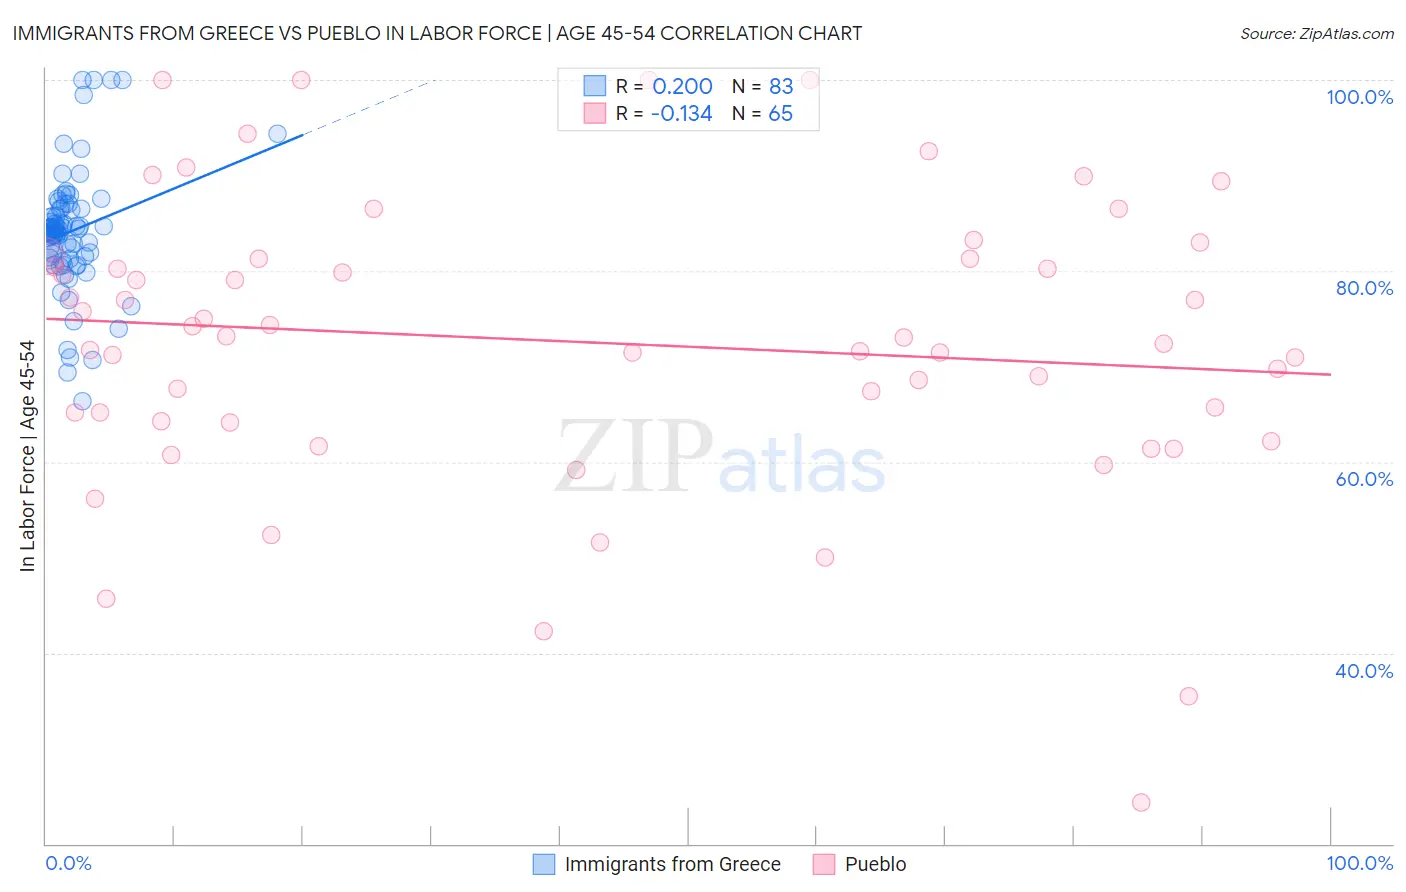
Immigrants from Greece vs Pueblo In Labor Force | Age 45-54 Correlation Chart
The statistical analysis conducted on geographies consisting of 216,863,996 people shows a weak positive correlation between the proportion of Immigrants from Greece and labor force participation rate among population between the ages 45 and 54 in the United States with a correlation coefficient (R) of 0.200 and weighted average of 83.6%. Similarly, the statistical analysis conducted on geographies consisting of 120,065,193 people shows a poor negative correlation between the proportion of Pueblo and labor force participation rate among population between the ages 45 and 54 in the United States with a correlation coefficient (R) of -0.134 and weighted average of 75.5%, a difference of 10.7%.
In Labor Force | Age 45-54 Correlation Summary
| Measurement | Immigrants from Greece | Pueblo |
| Minimum | 66.4% | 24.3% |
| Maximum | 100.0% | 100.0% |
| Range | 33.6% | 75.7% |
| Mean | 84.1% | 72.6% |
| Median | 84.3% | 73.0% |
| Interquartile 25% (IQ1) | 81.3% | 64.2% |
| Interquartile 75% (IQ3) | 86.5% | 81.3% |
| Interquartile Range (IQR) | 5.2% | 17.1% |
| Standard Deviation (Sample) | 6.3% | 15.2% |
| Standard Deviation (Population) | 6.3% | 15.1% |
Similar Demographics by In Labor Force | Age 45-54
Demographics Similar to Immigrants from Greece by In Labor Force | Age 45-54
In terms of in labor force | age 45-54, the demographic groups most similar to Immigrants from Greece are Immigrants from Turkey (83.6%, a difference of 0.010%), Polish (83.6%, a difference of 0.010%), Peruvian (83.6%, a difference of 0.010%), Somali (83.5%, a difference of 0.020%), and Macedonian (83.5%, a difference of 0.020%).
| Demographics | Rating | Rank | In Labor Force | Age 45-54 |
| Venezuelans | 99.2 /100 | #43 | Exceptional 83.6% |
| Burmese | 99.1 /100 | #44 | Exceptional 83.6% |
| Immigrants | Hong Kong | 99.1 /100 | #45 | Exceptional 83.6% |
| Lithuanians | 99.1 /100 | #46 | Exceptional 83.6% |
| Croatians | 99.0 /100 | #47 | Exceptional 83.6% |
| Immigrants | Poland | 99.0 /100 | #48 | Exceptional 83.6% |
| Immigrants | Morocco | 99.0 /100 | #49 | Exceptional 83.6% |
| Immigrants | Greece | 98.8 /100 | #50 | Exceptional 83.6% |
| Immigrants | Turkey | 98.8 /100 | #51 | Exceptional 83.6% |
| Poles | 98.7 /100 | #52 | Exceptional 83.6% |
| Peruvians | 98.7 /100 | #53 | Exceptional 83.6% |
| Somalis | 98.7 /100 | #54 | Exceptional 83.5% |
| Macedonians | 98.7 /100 | #55 | Exceptional 83.5% |
| Immigrants | Peru | 98.6 /100 | #56 | Exceptional 83.5% |
| Paraguayans | 98.5 /100 | #57 | Exceptional 83.5% |
Demographics Similar to Pueblo by In Labor Force | Age 45-54
In terms of in labor force | age 45-54, the demographic groups most similar to Pueblo are Lumbee (75.6%, a difference of 0.12%), Tohono O'odham (75.1%, a difference of 0.49%), Puerto Rican (75.9%, a difference of 0.58%), Hopi (75.0%, a difference of 0.67%), and Yuman (76.3%, a difference of 1.1%).
| Demographics | Rating | Rank | In Labor Force | Age 45-54 |
| Natives/Alaskans | 0.0 /100 | #333 | Tragic 77.1% |
| Apache | 0.0 /100 | #334 | Tragic 77.1% |
| Arapaho | 0.0 /100 | #335 | Tragic 77.1% |
| Paiute | 0.0 /100 | #336 | Tragic 76.7% |
| Ute | 0.0 /100 | #337 | Tragic 76.6% |
| Yuman | 0.0 /100 | #338 | Tragic 76.3% |
| Puerto Ricans | 0.0 /100 | #339 | Tragic 75.9% |
| Lumbee | 0.0 /100 | #340 | Tragic 75.6% |
| Pueblo | 0.0 /100 | #341 | Tragic 75.5% |
| Tohono O'odham | 0.0 /100 | #342 | Tragic 75.1% |
| Hopi | 0.0 /100 | #343 | Tragic 75.0% |
| Immigrants | Yemen | 0.0 /100 | #344 | Tragic 74.4% |
| Houma | 0.0 /100 | #345 | Tragic 74.1% |
| Pima | 0.0 /100 | #346 | Tragic 72.8% |
| Navajo | 0.0 /100 | #347 | Tragic 72.8% |