Immigrants from Greece vs Indian (Asian) In Labor Force | Age 45-54
COMPARE
Immigrants from Greece
Indian (Asian)
In Labor Force | Age 45-54
In Labor Force | Age 45-54 Comparison
Immigrants from Greece
Indians (Asian)
83.6%
IN LABOR FORCE | AGE 45-54
98.8/ 100
METRIC RATING
50th/ 347
METRIC RANK
83.3%
IN LABOR FORCE | AGE 45-54
95.5/ 100
METRIC RATING
89th/ 347
METRIC RANK
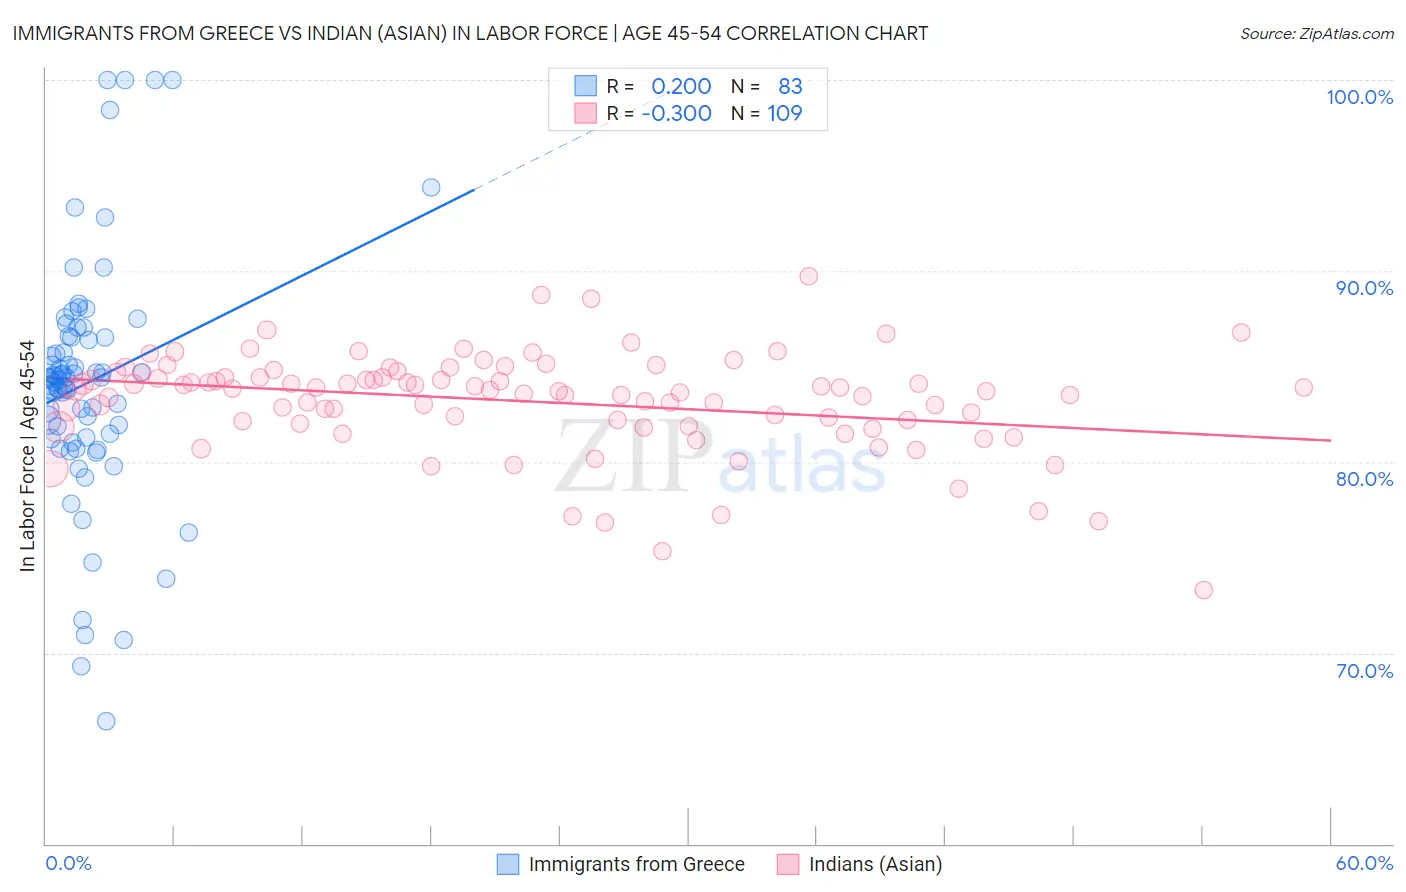
Immigrants from Greece vs Indian (Asian) In Labor Force | Age 45-54 Correlation Chart
The statistical analysis conducted on geographies consisting of 216,863,996 people shows a weak positive correlation between the proportion of Immigrants from Greece and labor force participation rate among population between the ages 45 and 54 in the United States with a correlation coefficient (R) of 0.200 and weighted average of 83.6%. Similarly, the statistical analysis conducted on geographies consisting of 494,727,636 people shows a mild negative correlation between the proportion of Indians (Asian) and labor force participation rate among population between the ages 45 and 54 in the United States with a correlation coefficient (R) of -0.300 and weighted average of 83.3%, a difference of 0.30%.
In Labor Force | Age 45-54 Correlation Summary
| Measurement | Immigrants from Greece | Indian (Asian) |
| Minimum | 66.4% | 73.3% |
| Maximum | 100.0% | 89.7% |
| Range | 33.6% | 16.4% |
| Mean | 84.1% | 83.2% |
| Median | 84.3% | 83.8% |
| Interquartile 25% (IQ1) | 81.3% | 82.1% |
| Interquartile 75% (IQ3) | 86.5% | 84.6% |
| Interquartile Range (IQR) | 5.2% | 2.5% |
| Standard Deviation (Sample) | 6.3% | 2.6% |
| Standard Deviation (Population) | 6.3% | 2.6% |
Similar Demographics by In Labor Force | Age 45-54
Demographics Similar to Immigrants from Greece by In Labor Force | Age 45-54
In terms of in labor force | age 45-54, the demographic groups most similar to Immigrants from Greece are Immigrants from Turkey (83.6%, a difference of 0.010%), Polish (83.6%, a difference of 0.010%), Peruvian (83.6%, a difference of 0.010%), Somali (83.5%, a difference of 0.020%), and Macedonian (83.5%, a difference of 0.020%).
| Demographics | Rating | Rank | In Labor Force | Age 45-54 |
| Venezuelans | 99.2 /100 | #43 | Exceptional 83.6% |
| Burmese | 99.1 /100 | #44 | Exceptional 83.6% |
| Immigrants | Hong Kong | 99.1 /100 | #45 | Exceptional 83.6% |
| Lithuanians | 99.1 /100 | #46 | Exceptional 83.6% |
| Croatians | 99.0 /100 | #47 | Exceptional 83.6% |
| Immigrants | Poland | 99.0 /100 | #48 | Exceptional 83.6% |
| Immigrants | Morocco | 99.0 /100 | #49 | Exceptional 83.6% |
| Immigrants | Greece | 98.8 /100 | #50 | Exceptional 83.6% |
| Immigrants | Turkey | 98.8 /100 | #51 | Exceptional 83.6% |
| Poles | 98.7 /100 | #52 | Exceptional 83.6% |
| Peruvians | 98.7 /100 | #53 | Exceptional 83.6% |
| Somalis | 98.7 /100 | #54 | Exceptional 83.5% |
| Macedonians | 98.7 /100 | #55 | Exceptional 83.5% |
| Immigrants | Peru | 98.6 /100 | #56 | Exceptional 83.5% |
| Paraguayans | 98.5 /100 | #57 | Exceptional 83.5% |
Demographics Similar to Indians (Asian) by In Labor Force | Age 45-54
In terms of in labor force | age 45-54, the demographic groups most similar to Indians (Asian) are Immigrants from Eastern Europe (83.3%, a difference of 0.0%), Immigrants from Asia (83.3%, a difference of 0.0%), Immigrants from Japan (83.3%, a difference of 0.0%), South American (83.3%, a difference of 0.0%), and Immigrants from Northern Africa (83.3%, a difference of 0.010%).
| Demographics | Rating | Rank | In Labor Force | Age 45-54 |
| Immigrants | Eastern Asia | 96.3 /100 | #82 | Exceptional 83.4% |
| Immigrants | Zimbabwe | 96.3 /100 | #83 | Exceptional 83.4% |
| Immigrants | Bosnia and Herzegovina | 96.0 /100 | #84 | Exceptional 83.3% |
| Greeks | 95.9 /100 | #85 | Exceptional 83.3% |
| Immigrants | Northern Africa | 95.7 /100 | #86 | Exceptional 83.3% |
| Immigrants | Eastern Europe | 95.6 /100 | #87 | Exceptional 83.3% |
| Immigrants | Asia | 95.6 /100 | #88 | Exceptional 83.3% |
| Indians (Asian) | 95.5 /100 | #89 | Exceptional 83.3% |
| Immigrants | Japan | 95.5 /100 | #90 | Exceptional 83.3% |
| South Americans | 95.5 /100 | #91 | Exceptional 83.3% |
| Danes | 95.3 /100 | #92 | Exceptional 83.3% |
| Italians | 95.1 /100 | #93 | Exceptional 83.3% |
| Argentineans | 94.9 /100 | #94 | Exceptional 83.3% |
| Immigrants | Argentina | 94.9 /100 | #95 | Exceptional 83.3% |
| Immigrants | Kuwait | 94.8 /100 | #96 | Exceptional 83.3% |