Immigrants from Fiji vs Immigrants from South Central Asia 8th Grade
COMPARE
Immigrants from Fiji
Immigrants from South Central Asia
8th Grade
8th Grade Comparison
Immigrants from Fiji
Immigrants from South Central Asia
93.2%
8TH GRADE
0.0/ 100
METRIC RATING
320th/ 347
METRIC RANK
96.1%
8TH GRADE
89.4/ 100
METRIC RATING
140th/ 347
METRIC RANK
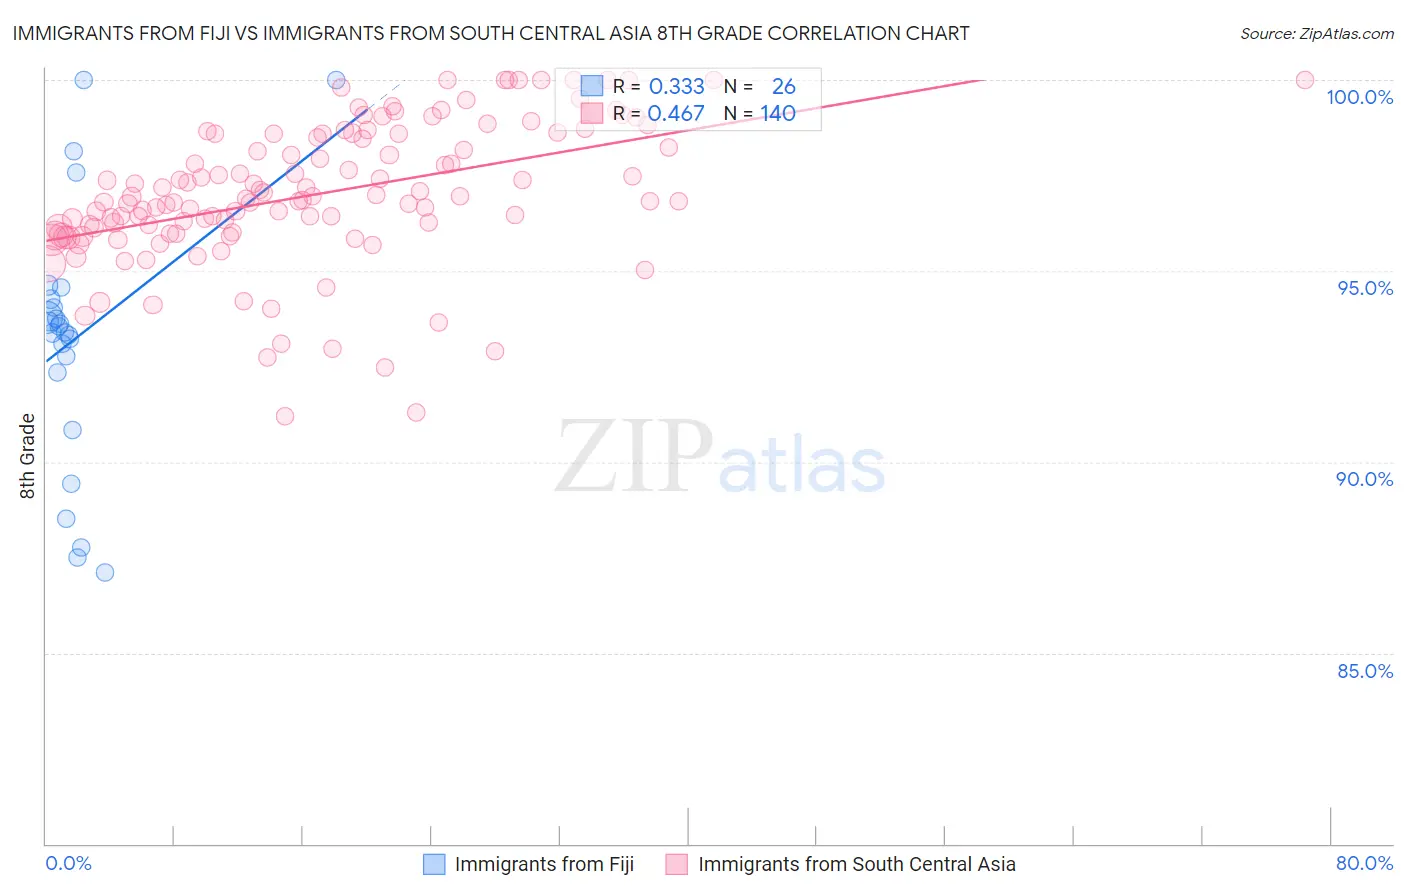
Immigrants from Fiji vs Immigrants from South Central Asia 8th Grade Correlation Chart
The statistical analysis conducted on geographies consisting of 93,756,204 people shows a mild positive correlation between the proportion of Immigrants from Fiji and percentage of population with at least 8th grade education in the United States with a correlation coefficient (R) of 0.333 and weighted average of 93.2%. Similarly, the statistical analysis conducted on geographies consisting of 473,113,181 people shows a moderate positive correlation between the proportion of Immigrants from South Central Asia and percentage of population with at least 8th grade education in the United States with a correlation coefficient (R) of 0.467 and weighted average of 96.1%, a difference of 3.1%.
8th Grade Correlation Summary
| Measurement | Immigrants from Fiji | Immigrants from South Central Asia |
| Minimum | 87.1% | 91.2% |
| Maximum | 100.0% | 100.0% |
| Range | 12.9% | 8.8% |
| Mean | 93.2% | 97.0% |
| Median | 93.5% | 96.9% |
| Interquartile 25% (IQ1) | 92.4% | 96.0% |
| Interquartile 75% (IQ3) | 94.3% | 98.6% |
| Interquartile Range (IQR) | 1.9% | 2.6% |
| Standard Deviation (Sample) | 3.4% | 1.8% |
| Standard Deviation (Population) | 3.3% | 1.8% |
Similar Demographics by 8th Grade
Demographics Similar to Immigrants from Fiji by 8th Grade
In terms of 8th grade, the demographic groups most similar to Immigrants from Fiji are Immigrants from Cuba (93.2%, a difference of 0.030%), Puerto Rican (93.2%, a difference of 0.060%), Immigrants from Ecuador (93.3%, a difference of 0.070%), Immigrants from Cambodia (93.3%, a difference of 0.12%), and Belizean (93.1%, a difference of 0.13%).
| Demographics | Rating | Rank | 8th Grade |
| Immigrants | Caribbean | 0.0 /100 | #313 | Tragic 93.5% |
| Immigrants | Vietnam | 0.0 /100 | #314 | Tragic 93.5% |
| Vietnamese | 0.0 /100 | #315 | Tragic 93.5% |
| Immigrants | Cambodia | 0.0 /100 | #316 | Tragic 93.3% |
| Immigrants | Ecuador | 0.0 /100 | #317 | Tragic 93.3% |
| Puerto Ricans | 0.0 /100 | #318 | Tragic 93.2% |
| Immigrants | Cuba | 0.0 /100 | #319 | Tragic 93.2% |
| Immigrants | Fiji | 0.0 /100 | #320 | Tragic 93.2% |
| Belizeans | 0.0 /100 | #321 | Tragic 93.1% |
| Nicaraguans | 0.0 /100 | #322 | Tragic 93.0% |
| Immigrants | Belize | 0.0 /100 | #323 | Tragic 92.9% |
| Nepalese | 0.0 /100 | #324 | Tragic 92.8% |
| Dominicans | 0.0 /100 | #325 | Tragic 92.8% |
| Central American Indians | 0.0 /100 | #326 | Tragic 92.7% |
| Immigrants | Azores | 0.0 /100 | #327 | Tragic 92.5% |
Demographics Similar to Immigrants from South Central Asia by 8th Grade
In terms of 8th grade, the demographic groups most similar to Immigrants from South Central Asia are Burmese (96.1%, a difference of 0.010%), Hmong (96.1%, a difference of 0.010%), Cambodian (96.1%, a difference of 0.020%), Immigrants from Turkey (96.1%, a difference of 0.040%), and Immigrants from Hungary (96.1%, a difference of 0.040%).
| Demographics | Rating | Rank | 8th Grade |
| Immigrants | Turkey | 91.7 /100 | #133 | Exceptional 96.1% |
| Immigrants | Hungary | 91.5 /100 | #134 | Exceptional 96.1% |
| Basques | 91.5 /100 | #135 | Exceptional 96.1% |
| Jordanians | 91.3 /100 | #136 | Exceptional 96.1% |
| Cambodians | 90.6 /100 | #137 | Exceptional 96.1% |
| Burmese | 90.2 /100 | #138 | Exceptional 96.1% |
| Hmong | 89.7 /100 | #139 | Excellent 96.1% |
| Immigrants | South Central Asia | 89.4 /100 | #140 | Excellent 96.1% |
| Immigrants | Greece | 85.9 /100 | #141 | Excellent 96.0% |
| Immigrants | Eastern Europe | 85.4 /100 | #142 | Excellent 96.0% |
| Spanish | 85.1 /100 | #143 | Excellent 96.0% |
| Immigrants | Belarus | 84.8 /100 | #144 | Excellent 96.0% |
| Lumbee | 84.1 /100 | #145 | Excellent 96.0% |
| Israelis | 84.1 /100 | #146 | Excellent 96.0% |
| Colville | 84.0 /100 | #147 | Excellent 96.0% |