Immigrants from Fiji vs Immigrants from South Central Asia In Labor Force | Age 35-44
COMPARE
Immigrants from Fiji
Immigrants from South Central Asia
In Labor Force | Age 35-44
In Labor Force | Age 35-44 Comparison
Immigrants from Fiji
Immigrants from South Central Asia
83.2%
IN LABOR FORCE | AGE 35-44
0.0/ 100
METRIC RATING
272nd/ 347
METRIC RANK
85.0%
IN LABOR FORCE | AGE 35-44
98.7/ 100
METRIC RATING
75th/ 347
METRIC RANK
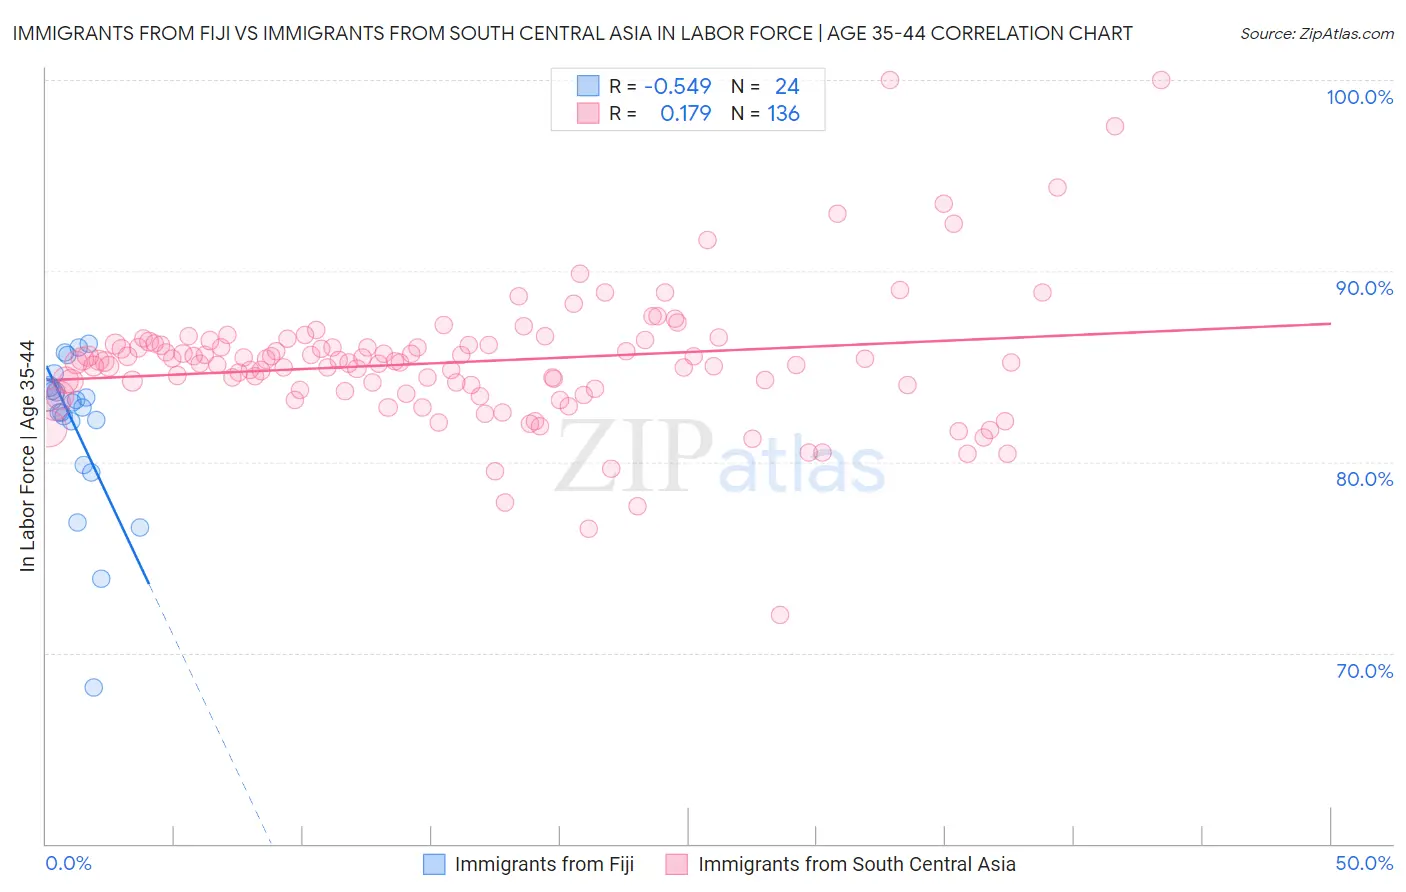
Immigrants from Fiji vs Immigrants from South Central Asia In Labor Force | Age 35-44 Correlation Chart
The statistical analysis conducted on geographies consisting of 93,754,712 people shows a substantial negative correlation between the proportion of Immigrants from Fiji and labor force participation rate among population between the ages 35 and 44 in the United States with a correlation coefficient (R) of -0.549 and weighted average of 83.2%. Similarly, the statistical analysis conducted on geographies consisting of 472,756,854 people shows a poor positive correlation between the proportion of Immigrants from South Central Asia and labor force participation rate among population between the ages 35 and 44 in the United States with a correlation coefficient (R) of 0.179 and weighted average of 85.0%, a difference of 2.1%.
In Labor Force | Age 35-44 Correlation Summary
| Measurement | Immigrants from Fiji | Immigrants from South Central Asia |
| Minimum | 68.2% | 72.0% |
| Maximum | 86.2% | 100.0% |
| Range | 18.0% | 28.0% |
| Mean | 81.8% | 85.2% |
| Median | 83.0% | 85.2% |
| Interquartile 25% (IQ1) | 81.0% | 83.8% |
| Interquartile 75% (IQ3) | 83.8% | 86.1% |
| Interquartile Range (IQR) | 2.8% | 2.4% |
| Standard Deviation (Sample) | 4.2% | 3.6% |
| Standard Deviation (Population) | 4.1% | 3.6% |
Similar Demographics by In Labor Force | Age 35-44
Demographics Similar to Immigrants from Fiji by In Labor Force | Age 35-44
In terms of in labor force | age 35-44, the demographic groups most similar to Immigrants from Fiji are Spanish (83.2%, a difference of 0.0%), Immigrants from Honduras (83.3%, a difference of 0.020%), French American Indian (83.2%, a difference of 0.020%), Nonimmigrants (83.2%, a difference of 0.020%), and Hawaiian (83.2%, a difference of 0.030%).
| Demographics | Rating | Rank | In Labor Force | Age 35-44 |
| Central Americans | 0.1 /100 | #265 | Tragic 83.5% |
| Spaniards | 0.1 /100 | #266 | Tragic 83.4% |
| Guamanians/Chamorros | 0.1 /100 | #267 | Tragic 83.4% |
| Hondurans | 0.1 /100 | #268 | Tragic 83.4% |
| Immigrants | Grenada | 0.1 /100 | #269 | Tragic 83.3% |
| Immigrants | Honduras | 0.0 /100 | #270 | Tragic 83.3% |
| French American Indians | 0.0 /100 | #271 | Tragic 83.2% |
| Immigrants | Fiji | 0.0 /100 | #272 | Tragic 83.2% |
| Spanish | 0.0 /100 | #273 | Tragic 83.2% |
| Immigrants | Nonimmigrants | 0.0 /100 | #274 | Tragic 83.2% |
| Hawaiians | 0.0 /100 | #275 | Tragic 83.2% |
| Delaware | 0.0 /100 | #276 | Tragic 83.2% |
| Samoans | 0.0 /100 | #277 | Tragic 83.2% |
| Belizeans | 0.0 /100 | #278 | Tragic 83.1% |
| Immigrants | Micronesia | 0.0 /100 | #279 | Tragic 83.1% |
Demographics Similar to Immigrants from South Central Asia by In Labor Force | Age 35-44
In terms of in labor force | age 35-44, the demographic groups most similar to Immigrants from South Central Asia are Colombian (85.0%, a difference of 0.010%), Immigrants from Cuba (84.9%, a difference of 0.010%), Immigrants from Turkey (84.9%, a difference of 0.010%), Immigrants from Singapore (85.0%, a difference of 0.020%), and Immigrants from Sri Lanka (85.0%, a difference of 0.020%).
| Demographics | Rating | Rank | In Labor Force | Age 35-44 |
| Italians | 99.1 /100 | #68 | Exceptional 85.0% |
| Sudanese | 99.0 /100 | #69 | Exceptional 85.0% |
| Brazilians | 99.0 /100 | #70 | Exceptional 85.0% |
| Russians | 99.0 /100 | #71 | Exceptional 85.0% |
| Immigrants | Singapore | 98.9 /100 | #72 | Exceptional 85.0% |
| Immigrants | Sri Lanka | 98.9 /100 | #73 | Exceptional 85.0% |
| Colombians | 98.8 /100 | #74 | Exceptional 85.0% |
| Immigrants | South Central Asia | 98.7 /100 | #75 | Exceptional 85.0% |
| Immigrants | Cuba | 98.6 /100 | #76 | Exceptional 84.9% |
| Immigrants | Turkey | 98.6 /100 | #77 | Exceptional 84.9% |
| Immigrants | Africa | 98.4 /100 | #78 | Exceptional 84.9% |
| Peruvians | 98.3 /100 | #79 | Exceptional 84.9% |
| Immigrants | Colombia | 98.3 /100 | #80 | Exceptional 84.9% |
| Immigrants | Eastern Europe | 98.3 /100 | #81 | Exceptional 84.9% |
| Immigrants | Sudan | 98.1 /100 | #82 | Exceptional 84.9% |