Immigrants from Fiji vs Bermudan In Labor Force | Age 16-19
COMPARE
Immigrants from Fiji
Bermudan
In Labor Force | Age 16-19
In Labor Force | Age 16-19 Comparison
Immigrants from Fiji
Bermudans
33.9%
IN LABOR FORCE | AGE 16-19
0.3/ 100
METRIC RATING
275th/ 347
METRIC RANK
36.9%
IN LABOR FORCE | AGE 16-19
69.3/ 100
METRIC RATING
163rd/ 347
METRIC RANK
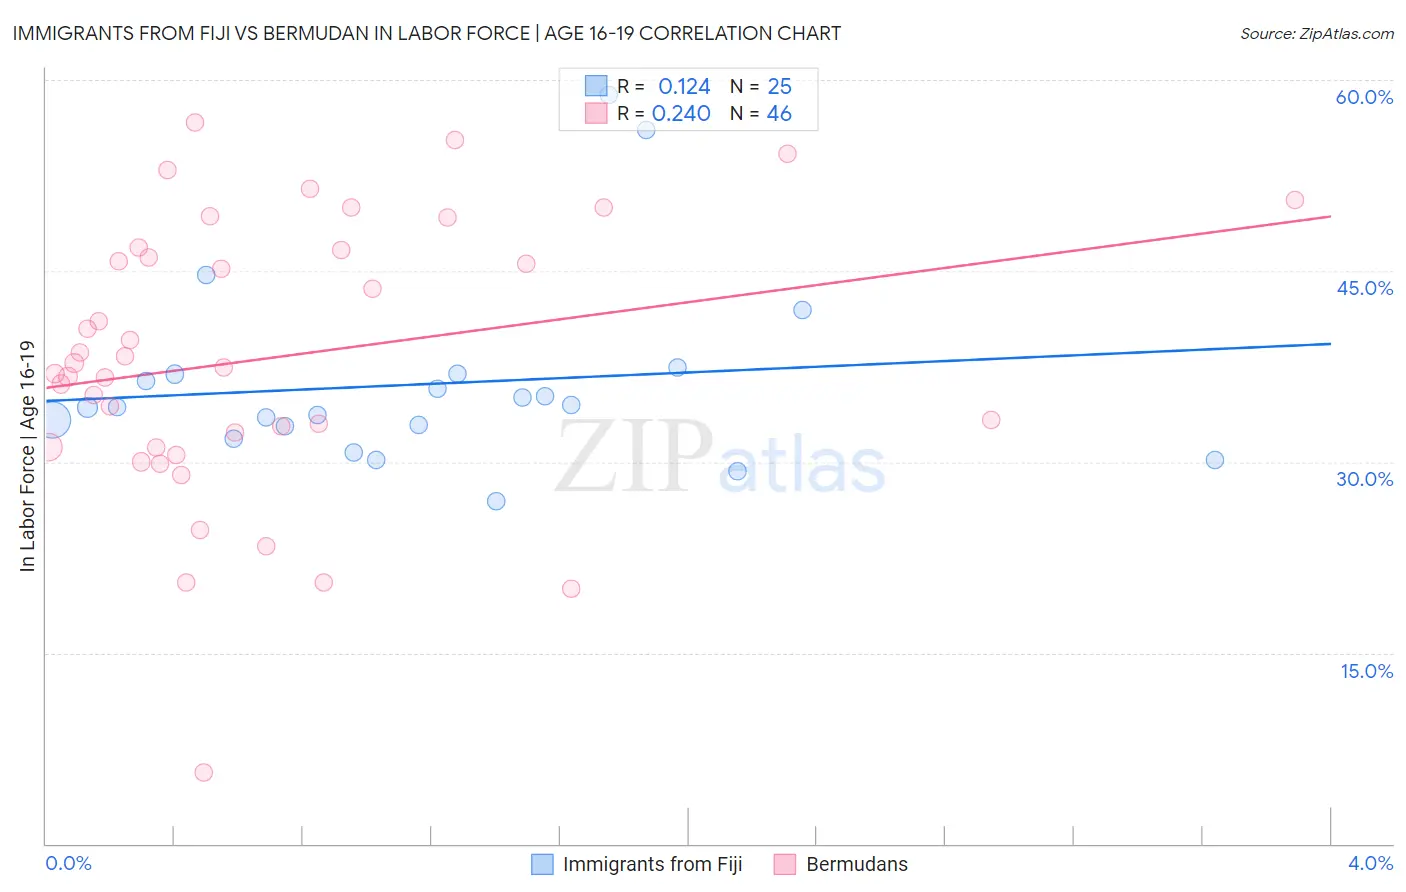
Immigrants from Fiji vs Bermudan In Labor Force | Age 16-19 Correlation Chart
The statistical analysis conducted on geographies consisting of 93,728,975 people shows a poor positive correlation between the proportion of Immigrants from Fiji and labor force participation rate among population between the ages 16 and 19 in the United States with a correlation coefficient (R) of 0.124 and weighted average of 33.9%. Similarly, the statistical analysis conducted on geographies consisting of 55,701,640 people shows a weak positive correlation between the proportion of Bermudans and labor force participation rate among population between the ages 16 and 19 in the United States with a correlation coefficient (R) of 0.240 and weighted average of 36.9%, a difference of 8.9%.
In Labor Force | Age 16-19 Correlation Summary
| Measurement | Immigrants from Fiji | Bermudan |
| Minimum | 26.9% | 5.6% |
| Maximum | 58.8% | 56.7% |
| Range | 31.9% | 51.1% |
| Mean | 36.1% | 38.2% |
| Median | 34.3% | 37.6% |
| Interquartile 25% (IQ1) | 32.3% | 31.2% |
| Interquartile 75% (IQ3) | 36.9% | 46.6% |
| Interquartile Range (IQR) | 4.6% | 15.4% |
| Standard Deviation (Sample) | 7.4% | 10.9% |
| Standard Deviation (Population) | 7.3% | 10.8% |
Similar Demographics by In Labor Force | Age 16-19
Demographics Similar to Immigrants from Fiji by In Labor Force | Age 16-19
In terms of in labor force | age 16-19, the demographic groups most similar to Immigrants from Fiji are Venezuelan (34.0%, a difference of 0.090%), Immigrants from Latin America (33.9%, a difference of 0.10%), Immigrants from Panama (34.0%, a difference of 0.18%), Menominee (33.9%, a difference of 0.22%), and Colombian (33.8%, a difference of 0.29%).
| Demographics | Rating | Rank | In Labor Force | Age 16-19 |
| Immigrants | Asia | 0.5 /100 | #268 | Tragic 34.1% |
| Pima | 0.5 /100 | #269 | Tragic 34.1% |
| Immigrants | Russia | 0.4 /100 | #270 | Tragic 34.1% |
| Central American Indians | 0.4 /100 | #271 | Tragic 34.1% |
| Asians | 0.4 /100 | #272 | Tragic 34.1% |
| Immigrants | Panama | 0.4 /100 | #273 | Tragic 34.0% |
| Venezuelans | 0.3 /100 | #274 | Tragic 34.0% |
| Immigrants | Fiji | 0.3 /100 | #275 | Tragic 33.9% |
| Immigrants | Latin America | 0.3 /100 | #276 | Tragic 33.9% |
| Menominee | 0.3 /100 | #277 | Tragic 33.9% |
| Colombians | 0.3 /100 | #278 | Tragic 33.8% |
| Paraguayans | 0.3 /100 | #279 | Tragic 33.8% |
| Taiwanese | 0.3 /100 | #280 | Tragic 33.8% |
| Cypriots | 0.3 /100 | #281 | Tragic 33.8% |
| Immigrants | Korea | 0.3 /100 | #282 | Tragic 33.8% |
Demographics Similar to Bermudans by In Labor Force | Age 16-19
In terms of in labor force | age 16-19, the demographic groups most similar to Bermudans are Immigrants from Jordan (36.9%, a difference of 0.010%), Immigrants from Kuwait (36.9%, a difference of 0.020%), Cambodian (37.0%, a difference of 0.13%), Yakama (36.9%, a difference of 0.14%), and Immigrants from Western Africa (36.9%, a difference of 0.15%).
| Demographics | Rating | Rank | In Labor Force | Age 16-19 |
| Kiowa | 80.4 /100 | #156 | Excellent 37.2% |
| Immigrants | Brazil | 76.5 /100 | #157 | Good 37.1% |
| Ute | 75.7 /100 | #158 | Good 37.1% |
| Yaqui | 74.4 /100 | #159 | Good 37.1% |
| Immigrants | Saudi Arabia | 73.9 /100 | #160 | Good 37.0% |
| Cambodians | 71.5 /100 | #161 | Good 37.0% |
| Immigrants | Jordan | 69.5 /100 | #162 | Good 36.9% |
| Bermudans | 69.3 /100 | #163 | Good 36.9% |
| Immigrants | Kuwait | 68.9 /100 | #164 | Good 36.9% |
| Yakama | 66.9 /100 | #165 | Good 36.9% |
| Immigrants | Western Africa | 66.7 /100 | #166 | Good 36.9% |
| Arabs | 63.6 /100 | #167 | Good 36.8% |
| Palestinians | 63.1 /100 | #168 | Good 36.8% |
| Immigrants | Latvia | 61.6 /100 | #169 | Good 36.8% |
| Immigrants | South Africa | 60.5 /100 | #170 | Good 36.8% |