Immigrants from Europe vs Immigrants from Zaire In Labor Force | Age > 16
COMPARE
Immigrants from Europe
Immigrants from Zaire
In Labor Force | Age > 16
In Labor Force | Age > 16 Comparison
Immigrants from Europe
Immigrants from Zaire
65.0%
IN LABOR FORCE | AGE > 16
33.6/ 100
METRIC RATING
193rd/ 347
METRIC RANK
67.2%
IN LABOR FORCE | AGE > 16
100.0/ 100
METRIC RATING
30th/ 347
METRIC RANK
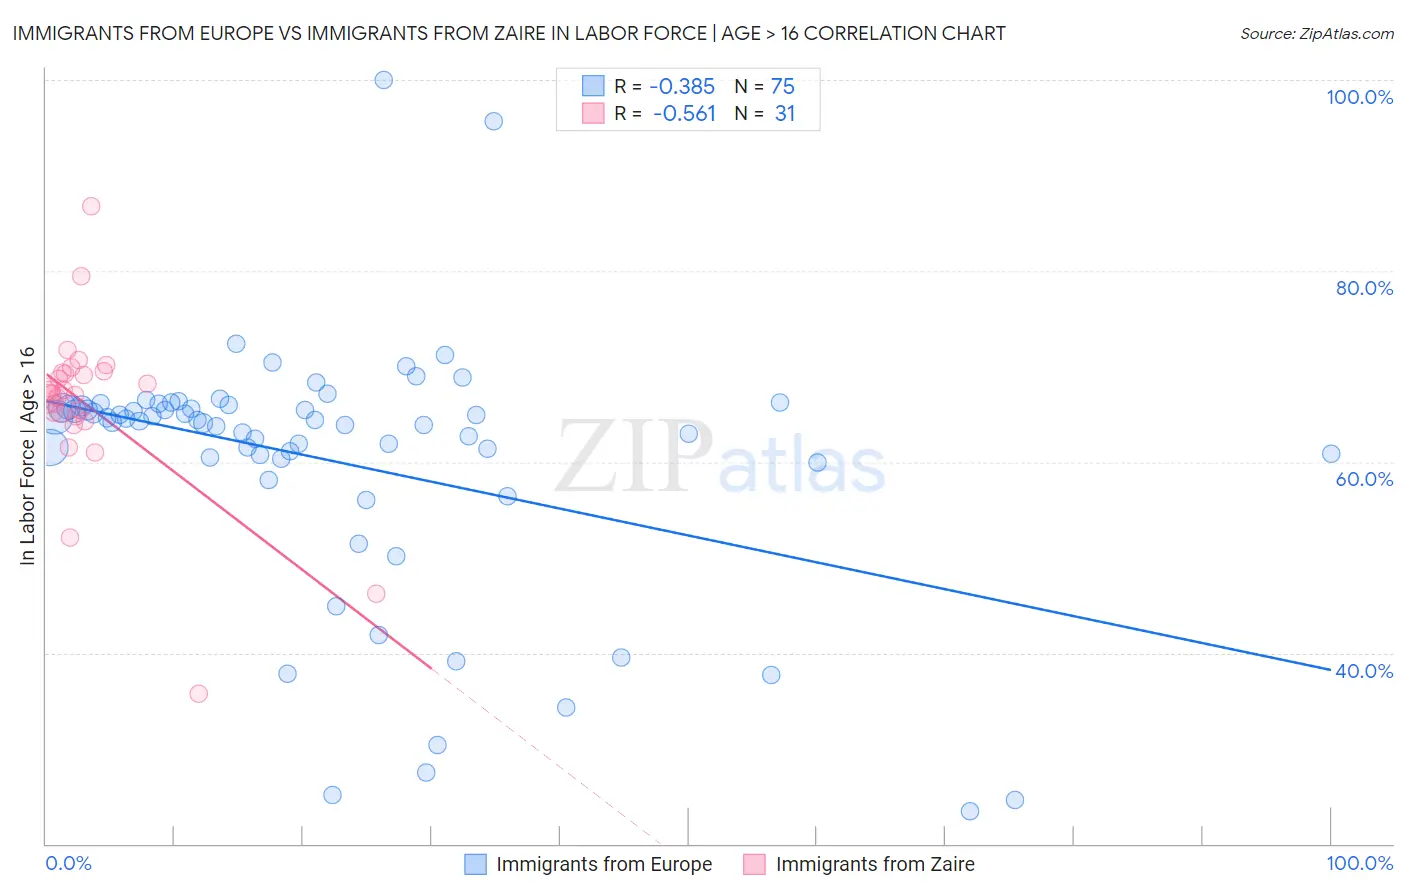
Immigrants from Europe vs Immigrants from Zaire In Labor Force | Age > 16 Correlation Chart
The statistical analysis conducted on geographies consisting of 547,430,773 people shows a mild negative correlation between the proportion of Immigrants from Europe and labor force participation rate among population ages 16 and over in the United States with a correlation coefficient (R) of -0.385 and weighted average of 65.0%. Similarly, the statistical analysis conducted on geographies consisting of 107,255,436 people shows a substantial negative correlation between the proportion of Immigrants from Zaire and labor force participation rate among population ages 16 and over in the United States with a correlation coefficient (R) of -0.561 and weighted average of 67.2%, a difference of 3.4%.
In Labor Force | Age > 16 Correlation Summary
| Measurement | Immigrants from Europe | Immigrants from Zaire |
| Minimum | 23.4% | 35.7% |
| Maximum | 100.0% | 86.8% |
| Range | 76.6% | 51.1% |
| Mean | 60.1% | 65.9% |
| Median | 64.3% | 67.2% |
| Interquartile 25% (IQ1) | 60.3% | 64.7% |
| Interquartile 75% (IQ3) | 65.8% | 69.3% |
| Interquartile Range (IQR) | 5.5% | 4.6% |
| Standard Deviation (Sample) | 13.6% | 8.8% |
| Standard Deviation (Population) | 13.5% | 8.7% |
Similar Demographics by In Labor Force | Age > 16
Demographics Similar to Immigrants from Europe by In Labor Force | Age > 16
In terms of in labor force | age > 16, the demographic groups most similar to Immigrants from Europe are Barbadian (65.0%, a difference of 0.0%), Scandinavian (65.0%, a difference of 0.0%), Immigrants from Fiji (65.0%, a difference of 0.0%), Immigrants from Portugal (65.0%, a difference of 0.010%), and Immigrants from Greece (65.0%, a difference of 0.010%).
| Demographics | Rating | Rank | In Labor Force | Age > 16 |
| Immigrants | Switzerland | 38.2 /100 | #186 | Fair 65.0% |
| Immigrants | Croatia | 35.7 /100 | #187 | Fair 65.0% |
| Immigrants | Portugal | 34.8 /100 | #188 | Fair 65.0% |
| Immigrants | Greece | 34.3 /100 | #189 | Fair 65.0% |
| Barbadians | 33.9 /100 | #190 | Fair 65.0% |
| Scandinavians | 33.7 /100 | #191 | Fair 65.0% |
| Immigrants | Fiji | 33.7 /100 | #192 | Fair 65.0% |
| Immigrants | Europe | 33.6 /100 | #193 | Fair 65.0% |
| Immigrants | Southern Europe | 31.3 /100 | #194 | Fair 65.0% |
| Romanians | 31.1 /100 | #195 | Fair 65.0% |
| Haitians | 30.6 /100 | #196 | Fair 65.0% |
| Immigrants | Italy | 28.7 /100 | #197 | Fair 65.0% |
| Greeks | 26.1 /100 | #198 | Fair 64.9% |
| Mexican American Indians | 23.1 /100 | #199 | Fair 64.9% |
| Armenians | 20.2 /100 | #200 | Fair 64.9% |
Demographics Similar to Immigrants from Zaire by In Labor Force | Age > 16
In terms of in labor force | age > 16, the demographic groups most similar to Immigrants from Zaire are Thai (67.2%, a difference of 0.010%), Immigrants from Morocco (67.2%, a difference of 0.040%), Ghanaian (67.1%, a difference of 0.10%), Zimbabwean (67.3%, a difference of 0.12%), and Immigrants from Congo (67.1%, a difference of 0.16%).
| Demographics | Rating | Rank | In Labor Force | Age > 16 |
| Cambodians | 100.0 /100 | #23 | Exceptional 67.4% |
| Ugandans | 100.0 /100 | #24 | Exceptional 67.4% |
| Immigrants | Africa | 100.0 /100 | #25 | Exceptional 67.4% |
| Immigrants | Cabo Verde | 100.0 /100 | #26 | Exceptional 67.3% |
| Zimbabweans | 100.0 /100 | #27 | Exceptional 67.3% |
| Immigrants | Morocco | 100.0 /100 | #28 | Exceptional 67.2% |
| Thais | 100.0 /100 | #29 | Exceptional 67.2% |
| Immigrants | Zaire | 100.0 /100 | #30 | Exceptional 67.2% |
| Ghanaians | 100.0 /100 | #31 | Exceptional 67.1% |
| Immigrants | Congo | 100.0 /100 | #32 | Exceptional 67.1% |
| Afghans | 100.0 /100 | #33 | Exceptional 67.1% |
| Immigrants | Ghana | 100.0 /100 | #34 | Exceptional 67.1% |
| Immigrants | South Central Asia | 100.0 /100 | #35 | Exceptional 67.1% |
| Immigrants | Western Africa | 100.0 /100 | #36 | Exceptional 67.1% |
| Immigrants | Afghanistan | 100.0 /100 | #37 | Exceptional 67.0% |