Slovene vs Yuman In Labor Force | Age 16-19
COMPARE
Slovene
Yuman
In Labor Force | Age 16-19
In Labor Force | Age 16-19 Comparison
Slovenes
Yuman
43.7%
IN LABOR FORCE | AGE 16-19
100.0/ 100
METRIC RATING
15th/ 347
METRIC RANK
27.7%
IN LABOR FORCE | AGE 16-19
0.0/ 100
METRIC RATING
343rd/ 347
METRIC RANK
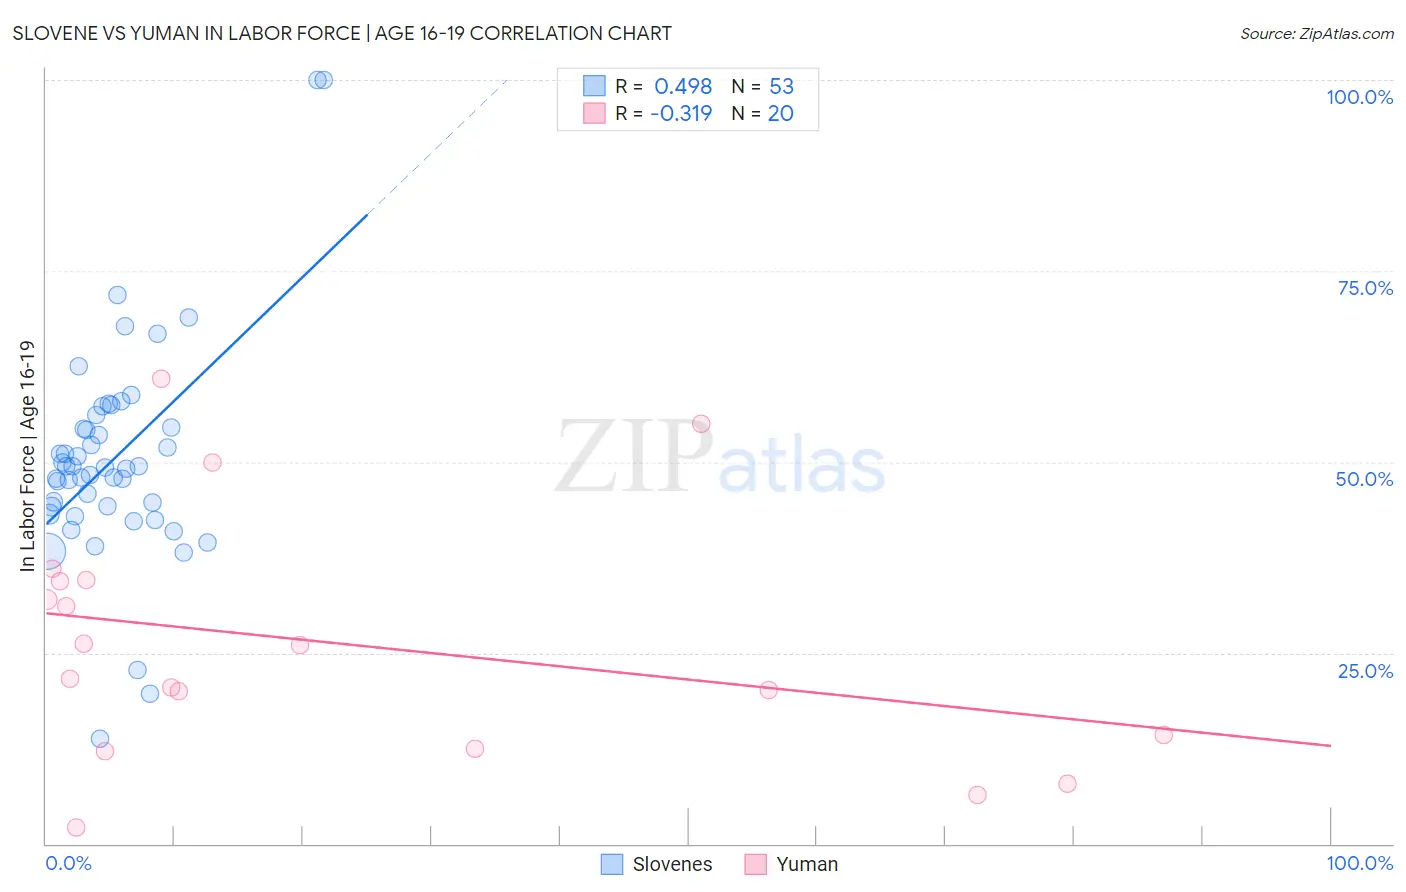
Slovene vs Yuman In Labor Force | Age 16-19 Correlation Chart
The statistical analysis conducted on geographies consisting of 261,051,776 people shows a moderate positive correlation between the proportion of Slovenes and labor force participation rate among population between the ages 16 and 19 in the United States with a correlation coefficient (R) of 0.498 and weighted average of 43.7%. Similarly, the statistical analysis conducted on geographies consisting of 40,663,980 people shows a mild negative correlation between the proportion of Yuman and labor force participation rate among population between the ages 16 and 19 in the United States with a correlation coefficient (R) of -0.319 and weighted average of 27.7%, a difference of 58.0%.
In Labor Force | Age 16-19 Correlation Summary
| Measurement | Slovene | Yuman |
| Minimum | 13.8% | 2.2% |
| Maximum | 100.0% | 60.9% |
| Range | 86.2% | 58.7% |
| Mean | 50.5% | 26.2% |
| Median | 49.2% | 23.8% |
| Interquartile 25% (IQ1) | 43.7% | 13.4% |
| Interquartile 75% (IQ3) | 55.3% | 34.5% |
| Interquartile Range (IQR) | 11.6% | 21.1% |
| Standard Deviation (Sample) | 14.6% | 16.0% |
| Standard Deviation (Population) | 14.4% | 15.6% |
Similar Demographics by In Labor Force | Age 16-19
Demographics Similar to Slovenes by In Labor Force | Age 16-19
In terms of in labor force | age 16-19, the demographic groups most similar to Slovenes are Czech (43.6%, a difference of 0.11%), Scandinavian (43.6%, a difference of 0.17%), French Canadian (43.6%, a difference of 0.25%), Chippewa (43.8%, a difference of 0.26%), and Dutch (43.8%, a difference of 0.36%).
| Demographics | Rating | Rank | In Labor Force | Age 16-19 |
| Immigrants | Cabo Verde | 100.0 /100 | #8 | Exceptional 44.7% |
| Cape Verdeans | 100.0 /100 | #9 | Exceptional 44.5% |
| Germans | 100.0 /100 | #10 | Exceptional 44.2% |
| Swedes | 100.0 /100 | #11 | Exceptional 44.1% |
| Finns | 100.0 /100 | #12 | Exceptional 43.9% |
| Dutch | 100.0 /100 | #13 | Exceptional 43.8% |
| Chippewa | 100.0 /100 | #14 | Exceptional 43.8% |
| Slovenes | 100.0 /100 | #15 | Exceptional 43.7% |
| Czechs | 100.0 /100 | #16 | Exceptional 43.6% |
| Scandinavians | 100.0 /100 | #17 | Exceptional 43.6% |
| French Canadians | 100.0 /100 | #18 | Exceptional 43.6% |
| Belgians | 100.0 /100 | #19 | Exceptional 43.4% |
| Swiss | 100.0 /100 | #20 | Exceptional 43.3% |
| Ottawa | 100.0 /100 | #21 | Exceptional 43.0% |
| Sudanese | 100.0 /100 | #22 | Exceptional 42.9% |
Demographics Similar to Yuman by In Labor Force | Age 16-19
In terms of in labor force | age 16-19, the demographic groups most similar to Yuman are Guyanese (27.4%, a difference of 0.76%), Immigrants from Guyana (27.3%, a difference of 1.4%), Immigrants from Barbados (29.0%, a difference of 4.8%), Immigrants from Armenia (29.0%, a difference of 5.0%), and British West Indian (29.1%, a difference of 5.2%).
| Demographics | Rating | Rank | In Labor Force | Age 16-19 |
| Immigrants | Hong Kong | 0.0 /100 | #333 | Tragic 30.5% |
| Puerto Ricans | 0.0 /100 | #334 | Tragic 30.3% |
| Immigrants | Cuba | 0.0 /100 | #335 | Tragic 30.2% |
| Immigrants | Trinidad and Tobago | 0.0 /100 | #336 | Tragic 30.2% |
| Immigrants | Bangladesh | 0.0 /100 | #337 | Tragic 30.0% |
| Vietnamese | 0.0 /100 | #338 | Tragic 29.6% |
| Immigrants | Uzbekistan | 0.0 /100 | #339 | Tragic 29.2% |
| British West Indians | 0.0 /100 | #340 | Tragic 29.1% |
| Immigrants | Armenia | 0.0 /100 | #341 | Tragic 29.0% |
| Immigrants | Barbados | 0.0 /100 | #342 | Tragic 29.0% |
| Yuman | 0.0 /100 | #343 | Tragic 27.7% |
| Guyanese | 0.0 /100 | #344 | Tragic 27.4% |
| Immigrants | Guyana | 0.0 /100 | #345 | Tragic 27.3% |
| Immigrants | St. Vincent and the Grenadines | 0.0 /100 | #346 | Tragic 26.3% |
| Immigrants | Grenada | 0.0 /100 | #347 | Tragic 25.4% |