Immigrants from Eritrea vs Immigrants from Western Europe In Labor Force | Age 20-24
COMPARE
Immigrants from Eritrea
Immigrants from Western Europe
In Labor Force | Age 20-24
In Labor Force | Age 20-24 Comparison
Immigrants from Eritrea
Immigrants from Western Europe
77.0%
IN LABOR FORCE | AGE 20-24
99.9/ 100
METRIC RATING
61st/ 347
METRIC RANK
75.3%
IN LABOR FORCE | AGE 20-24
71.5/ 100
METRIC RATING
157th/ 347
METRIC RANK
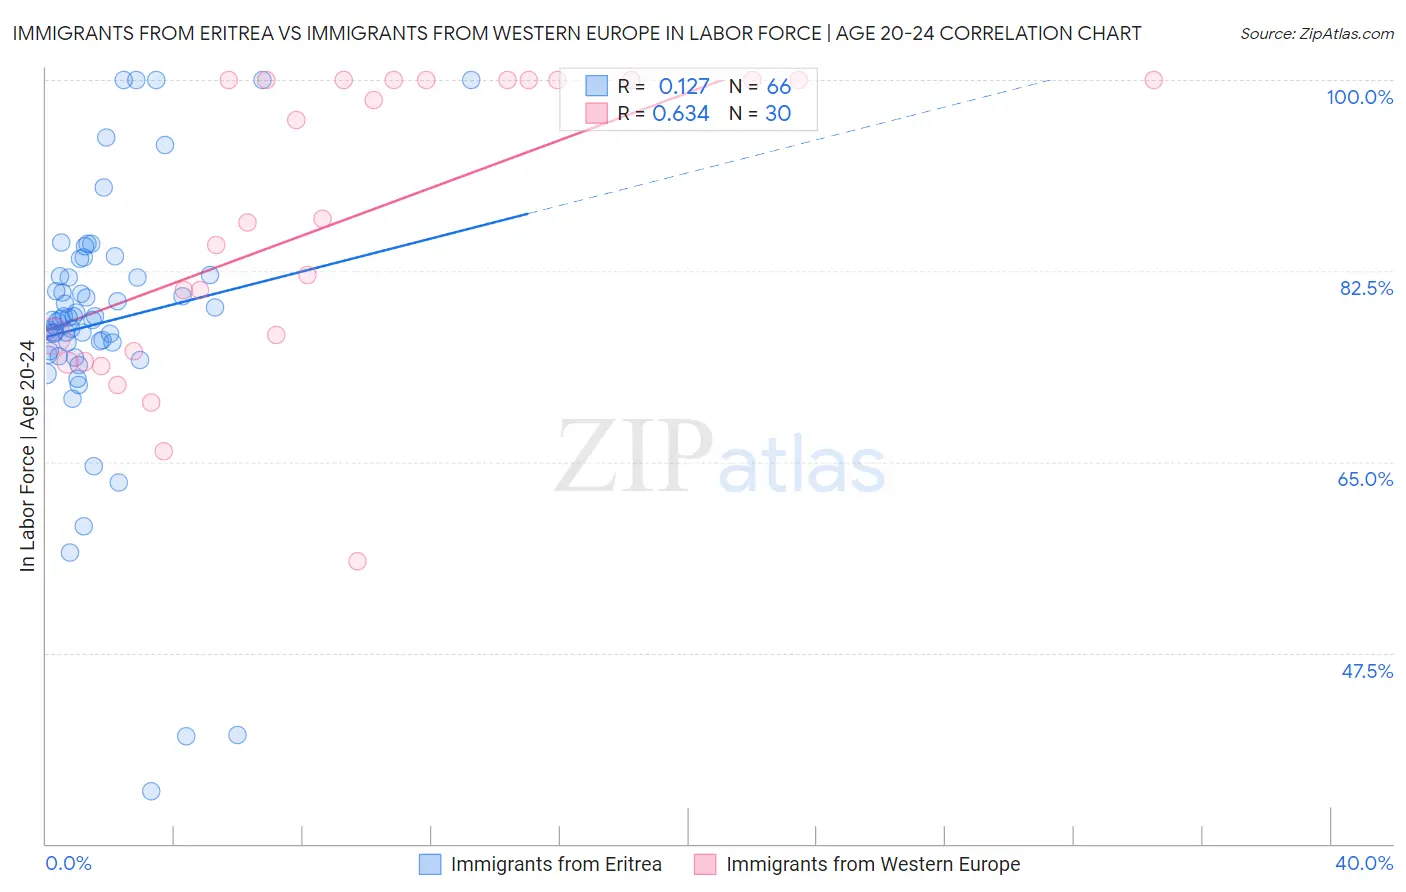
Immigrants from Eritrea vs Immigrants from Western Europe In Labor Force | Age 20-24 Correlation Chart
The statistical analysis conducted on geographies consisting of 104,852,788 people shows a poor positive correlation between the proportion of Immigrants from Eritrea and labor force participation rate among population between the ages 20 and 24 in the United States with a correlation coefficient (R) of 0.127 and weighted average of 77.0%. Similarly, the statistical analysis conducted on geographies consisting of 493,597,836 people shows a significant positive correlation between the proportion of Immigrants from Western Europe and labor force participation rate among population between the ages 20 and 24 in the United States with a correlation coefficient (R) of 0.634 and weighted average of 75.3%, a difference of 2.2%.
In Labor Force | Age 20-24 Correlation Summary
| Measurement | Immigrants from Eritrea | Immigrants from Western Europe |
| Minimum | 34.8% | 55.9% |
| Maximum | 100.0% | 100.0% |
| Range | 65.2% | 44.1% |
| Mean | 77.8% | 87.1% |
| Median | 78.0% | 87.1% |
| Interquartile 25% (IQ1) | 75.1% | 75.1% |
| Interquartile 75% (IQ3) | 82.1% | 100.0% |
| Interquartile Range (IQR) | 6.9% | 24.9% |
| Standard Deviation (Sample) | 12.2% | 13.3% |
| Standard Deviation (Population) | 12.1% | 13.1% |
Similar Demographics by In Labor Force | Age 20-24
Demographics Similar to Immigrants from Eritrea by In Labor Force | Age 20-24
In terms of in labor force | age 20-24, the demographic groups most similar to Immigrants from Eritrea are Immigrants from Kenya (77.0%, a difference of 0.010%), Lithuanian (77.0%, a difference of 0.010%), Kenyan (77.0%, a difference of 0.050%), White/Caucasian (76.9%, a difference of 0.050%), and Scotch-Irish (77.0%, a difference of 0.080%).
| Demographics | Rating | Rank | In Labor Force | Age 20-24 |
| Celtics | 99.9 /100 | #54 | Exceptional 77.1% |
| Immigrants | Liberia | 99.9 /100 | #55 | Exceptional 77.1% |
| Europeans | 99.9 /100 | #56 | Exceptional 77.1% |
| Chippewa | 99.9 /100 | #57 | Exceptional 77.1% |
| Hawaiians | 99.9 /100 | #58 | Exceptional 77.0% |
| Scotch-Irish | 99.9 /100 | #59 | Exceptional 77.0% |
| Kenyans | 99.9 /100 | #60 | Exceptional 77.0% |
| Immigrants | Eritrea | 99.9 /100 | #61 | Exceptional 77.0% |
| Immigrants | Kenya | 99.9 /100 | #62 | Exceptional 77.0% |
| Lithuanians | 99.9 /100 | #63 | Exceptional 77.0% |
| Whites/Caucasians | 99.9 /100 | #64 | Exceptional 76.9% |
| Crow | 99.9 /100 | #65 | Exceptional 76.9% |
| Icelanders | 99.9 /100 | #66 | Exceptional 76.9% |
| Slavs | 99.9 /100 | #67 | Exceptional 76.9% |
| French American Indians | 99.8 /100 | #68 | Exceptional 76.8% |
Demographics Similar to Immigrants from Western Europe by In Labor Force | Age 20-24
In terms of in labor force | age 20-24, the demographic groups most similar to Immigrants from Western Europe are Immigrants from El Salvador (75.3%, a difference of 0.0%), Guatemalan (75.3%, a difference of 0.010%), Osage (75.3%, a difference of 0.010%), Immigrants from Guatemala (75.3%, a difference of 0.010%), and Immigrants from Bolivia (75.3%, a difference of 0.010%).
| Demographics | Rating | Rank | In Labor Force | Age 20-24 |
| Salvadorans | 74.8 /100 | #150 | Good 75.3% |
| Paiute | 74.1 /100 | #151 | Good 75.3% |
| Lebanese | 73.5 /100 | #152 | Good 75.3% |
| Guatemalans | 72.3 /100 | #153 | Good 75.3% |
| Osage | 72.3 /100 | #154 | Good 75.3% |
| Immigrants | Guatemala | 71.9 /100 | #155 | Good 75.3% |
| Immigrants | El Salvador | 71.7 /100 | #156 | Good 75.3% |
| Immigrants | Western Europe | 71.5 /100 | #157 | Good 75.3% |
| Immigrants | Bolivia | 71.0 /100 | #158 | Good 75.3% |
| South American Indians | 69.0 /100 | #159 | Good 75.3% |
| Japanese | 68.7 /100 | #160 | Good 75.3% |
| New Zealanders | 65.4 /100 | #161 | Good 75.2% |
| Immigrants | Romania | 64.6 /100 | #162 | Good 75.2% |
| Costa Ricans | 64.2 /100 | #163 | Good 75.2% |
| Bolivians | 64.0 /100 | #164 | Good 75.2% |