Immigrants from Eritrea vs Immigrants from Saudi Arabia In Labor Force | Age 20-24
COMPARE
Immigrants from Eritrea
Immigrants from Saudi Arabia
In Labor Force | Age 20-24
In Labor Force | Age 20-24 Comparison
Immigrants from Eritrea
Immigrants from Saudi Arabia
77.0%
IN LABOR FORCE | AGE 20-24
99.9/ 100
METRIC RATING
61st/ 347
METRIC RANK
73.9%
IN LABOR FORCE | AGE 20-24
1.5/ 100
METRIC RATING
248th/ 347
METRIC RANK
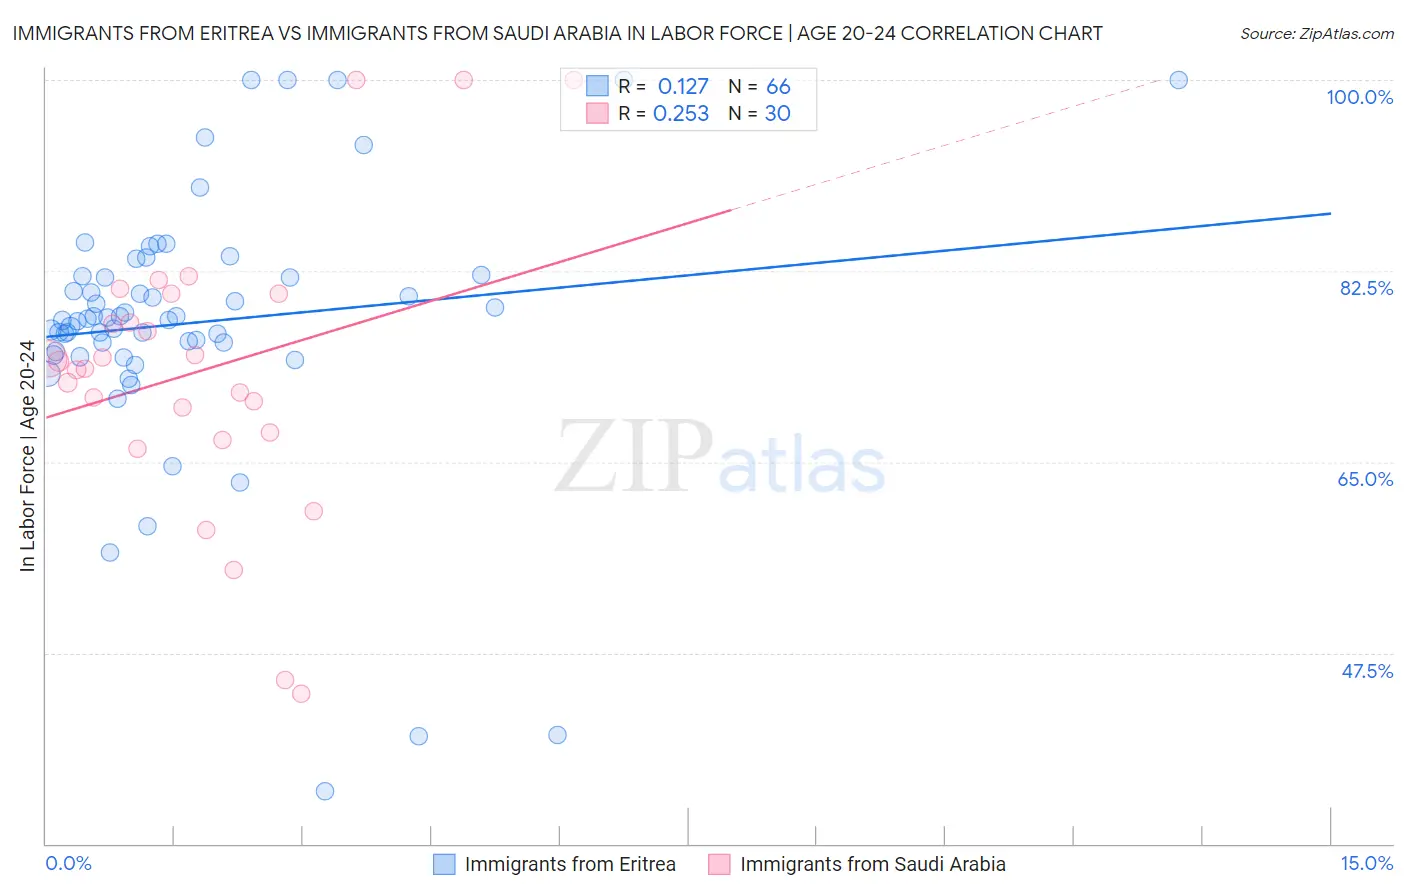
Immigrants from Eritrea vs Immigrants from Saudi Arabia In Labor Force | Age 20-24 Correlation Chart
The statistical analysis conducted on geographies consisting of 104,852,788 people shows a poor positive correlation between the proportion of Immigrants from Eritrea and labor force participation rate among population between the ages 20 and 24 in the United States with a correlation coefficient (R) of 0.127 and weighted average of 77.0%. Similarly, the statistical analysis conducted on geographies consisting of 164,291,801 people shows a weak positive correlation between the proportion of Immigrants from Saudi Arabia and labor force participation rate among population between the ages 20 and 24 in the United States with a correlation coefficient (R) of 0.253 and weighted average of 73.9%, a difference of 4.2%.
In Labor Force | Age 20-24 Correlation Summary
| Measurement | Immigrants from Eritrea | Immigrants from Saudi Arabia |
| Minimum | 34.8% | 43.8% |
| Maximum | 100.0% | 100.0% |
| Range | 65.2% | 56.2% |
| Mean | 77.8% | 73.4% |
| Median | 78.0% | 73.9% |
| Interquartile 25% (IQ1) | 75.1% | 67.7% |
| Interquartile 75% (IQ3) | 82.1% | 80.4% |
| Interquartile Range (IQR) | 6.9% | 12.7% |
| Standard Deviation (Sample) | 12.2% | 13.2% |
| Standard Deviation (Population) | 12.1% | 12.9% |
Similar Demographics by In Labor Force | Age 20-24
Demographics Similar to Immigrants from Eritrea by In Labor Force | Age 20-24
In terms of in labor force | age 20-24, the demographic groups most similar to Immigrants from Eritrea are Immigrants from Kenya (77.0%, a difference of 0.010%), Lithuanian (77.0%, a difference of 0.010%), Kenyan (77.0%, a difference of 0.050%), White/Caucasian (76.9%, a difference of 0.050%), and Scotch-Irish (77.0%, a difference of 0.080%).
| Demographics | Rating | Rank | In Labor Force | Age 20-24 |
| Celtics | 99.9 /100 | #54 | Exceptional 77.1% |
| Immigrants | Liberia | 99.9 /100 | #55 | Exceptional 77.1% |
| Europeans | 99.9 /100 | #56 | Exceptional 77.1% |
| Chippewa | 99.9 /100 | #57 | Exceptional 77.1% |
| Hawaiians | 99.9 /100 | #58 | Exceptional 77.0% |
| Scotch-Irish | 99.9 /100 | #59 | Exceptional 77.0% |
| Kenyans | 99.9 /100 | #60 | Exceptional 77.0% |
| Immigrants | Eritrea | 99.9 /100 | #61 | Exceptional 77.0% |
| Immigrants | Kenya | 99.9 /100 | #62 | Exceptional 77.0% |
| Lithuanians | 99.9 /100 | #63 | Exceptional 77.0% |
| Whites/Caucasians | 99.9 /100 | #64 | Exceptional 76.9% |
| Crow | 99.9 /100 | #65 | Exceptional 76.9% |
| Icelanders | 99.9 /100 | #66 | Exceptional 76.9% |
| Slavs | 99.9 /100 | #67 | Exceptional 76.9% |
| French American Indians | 99.8 /100 | #68 | Exceptional 76.8% |
Demographics Similar to Immigrants from Saudi Arabia by In Labor Force | Age 20-24
In terms of in labor force | age 20-24, the demographic groups most similar to Immigrants from Saudi Arabia are Colville (73.9%, a difference of 0.0%), Immigrants from Panama (73.9%, a difference of 0.030%), Black/African American (73.9%, a difference of 0.050%), Immigrants from Belgium (73.9%, a difference of 0.050%), and Turkish (73.9%, a difference of 0.070%).
| Demographics | Rating | Rank | In Labor Force | Age 20-24 |
| Immigrants | Senegal | 2.1 /100 | #241 | Tragic 74.0% |
| Thais | 2.1 /100 | #242 | Tragic 74.0% |
| Immigrants | Syria | 1.9 /100 | #243 | Tragic 74.0% |
| Immigrants | South Central Asia | 1.9 /100 | #244 | Tragic 74.0% |
| Turks | 1.8 /100 | #245 | Tragic 73.9% |
| Immigrants | Panama | 1.6 /100 | #246 | Tragic 73.9% |
| Colville | 1.5 /100 | #247 | Tragic 73.9% |
| Immigrants | Saudi Arabia | 1.5 /100 | #248 | Tragic 73.9% |
| Blacks/African Americans | 1.3 /100 | #249 | Tragic 73.9% |
| Immigrants | Belgium | 1.3 /100 | #250 | Tragic 73.9% |
| Immigrants | Egypt | 1.2 /100 | #251 | Tragic 73.8% |
| Immigrants | Kazakhstan | 1.1 /100 | #252 | Tragic 73.8% |
| Arapaho | 1.0 /100 | #253 | Tragic 73.8% |
| Ute | 1.0 /100 | #254 | Tragic 73.8% |
| Immigrants | Pakistan | 0.9 /100 | #255 | Tragic 73.8% |