Immigrants from Eritrea vs Iraqi In Labor Force | Age 20-24
COMPARE
Immigrants from Eritrea
Iraqi
In Labor Force | Age 20-24
In Labor Force | Age 20-24 Comparison
Immigrants from Eritrea
Iraqis
77.0%
IN LABOR FORCE | AGE 20-24
99.9/ 100
METRIC RATING
61st/ 347
METRIC RANK
76.0%
IN LABOR FORCE | AGE 20-24
96.6/ 100
METRIC RATING
108th/ 347
METRIC RANK
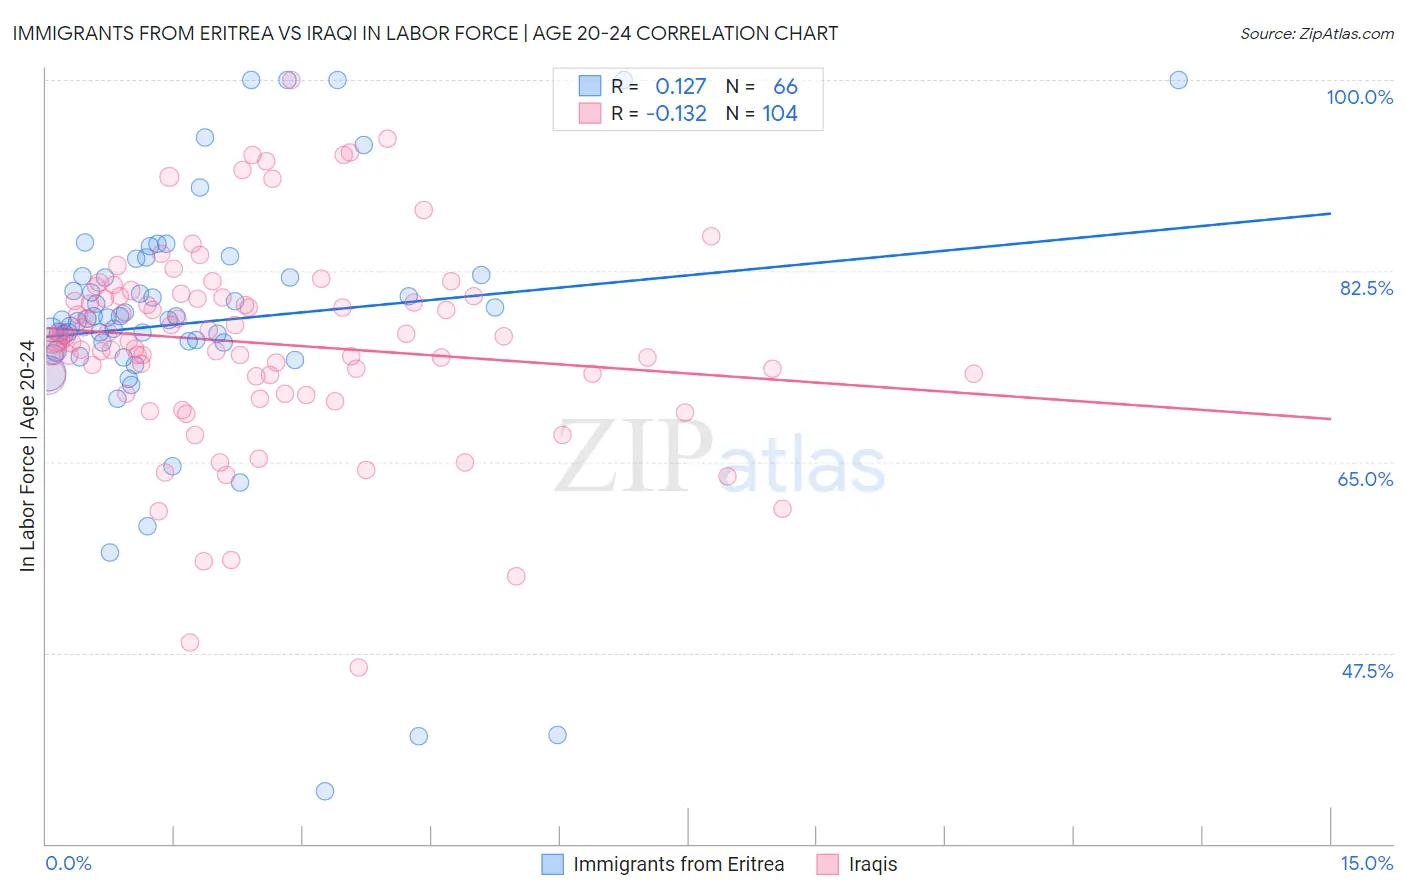
Immigrants from Eritrea vs Iraqi In Labor Force | Age 20-24 Correlation Chart
The statistical analysis conducted on geographies consisting of 104,852,788 people shows a poor positive correlation between the proportion of Immigrants from Eritrea and labor force participation rate among population between the ages 20 and 24 in the United States with a correlation coefficient (R) of 0.127 and weighted average of 77.0%. Similarly, the statistical analysis conducted on geographies consisting of 170,641,378 people shows a poor negative correlation between the proportion of Iraqis and labor force participation rate among population between the ages 20 and 24 in the United States with a correlation coefficient (R) of -0.132 and weighted average of 76.0%, a difference of 1.3%.
In Labor Force | Age 20-24 Correlation Summary
| Measurement | Immigrants from Eritrea | Iraqi |
| Minimum | 34.8% | 46.2% |
| Maximum | 100.0% | 100.0% |
| Range | 65.2% | 53.8% |
| Mean | 77.8% | 75.9% |
| Median | 78.0% | 76.1% |
| Interquartile 25% (IQ1) | 75.1% | 72.8% |
| Interquartile 75% (IQ3) | 82.1% | 80.1% |
| Interquartile Range (IQR) | 6.9% | 7.3% |
| Standard Deviation (Sample) | 12.2% | 9.1% |
| Standard Deviation (Population) | 12.1% | 9.1% |
Similar Demographics by In Labor Force | Age 20-24
Demographics Similar to Immigrants from Eritrea by In Labor Force | Age 20-24
In terms of in labor force | age 20-24, the demographic groups most similar to Immigrants from Eritrea are Immigrants from Kenya (77.0%, a difference of 0.010%), Lithuanian (77.0%, a difference of 0.010%), Kenyan (77.0%, a difference of 0.050%), White/Caucasian (76.9%, a difference of 0.050%), and Scotch-Irish (77.0%, a difference of 0.080%).
| Demographics | Rating | Rank | In Labor Force | Age 20-24 |
| Celtics | 99.9 /100 | #54 | Exceptional 77.1% |
| Immigrants | Liberia | 99.9 /100 | #55 | Exceptional 77.1% |
| Europeans | 99.9 /100 | #56 | Exceptional 77.1% |
| Chippewa | 99.9 /100 | #57 | Exceptional 77.1% |
| Hawaiians | 99.9 /100 | #58 | Exceptional 77.0% |
| Scotch-Irish | 99.9 /100 | #59 | Exceptional 77.0% |
| Kenyans | 99.9 /100 | #60 | Exceptional 77.0% |
| Immigrants | Eritrea | 99.9 /100 | #61 | Exceptional 77.0% |
| Immigrants | Kenya | 99.9 /100 | #62 | Exceptional 77.0% |
| Lithuanians | 99.9 /100 | #63 | Exceptional 77.0% |
| Whites/Caucasians | 99.9 /100 | #64 | Exceptional 76.9% |
| Crow | 99.9 /100 | #65 | Exceptional 76.9% |
| Icelanders | 99.9 /100 | #66 | Exceptional 76.9% |
| Slavs | 99.9 /100 | #67 | Exceptional 76.9% |
| French American Indians | 99.8 /100 | #68 | Exceptional 76.8% |
Demographics Similar to Iraqis by In Labor Force | Age 20-24
In terms of in labor force | age 20-24, the demographic groups most similar to Iraqis are Greek (76.0%, a difference of 0.030%), Immigrants from Uganda (76.0%, a difference of 0.060%), Macedonian (76.0%, a difference of 0.070%), Immigrants from Nepal (76.0%, a difference of 0.070%), and Cherokee (75.9%, a difference of 0.080%).
| Demographics | Rating | Rank | In Labor Force | Age 20-24 |
| Immigrants | Poland | 97.7 /100 | #101 | Exceptional 76.1% |
| Latvians | 97.6 /100 | #102 | Exceptional 76.1% |
| Immigrants | North Macedonia | 97.5 /100 | #103 | Exceptional 76.1% |
| Macedonians | 97.2 /100 | #104 | Exceptional 76.0% |
| Immigrants | Nepal | 97.2 /100 | #105 | Exceptional 76.0% |
| Immigrants | Uganda | 97.1 /100 | #106 | Exceptional 76.0% |
| Greeks | 96.9 /100 | #107 | Exceptional 76.0% |
| Iraqis | 96.6 /100 | #108 | Exceptional 76.0% |
| Cherokee | 95.8 /100 | #109 | Exceptional 75.9% |
| Immigrants | Morocco | 95.8 /100 | #110 | Exceptional 75.9% |
| Ukrainians | 95.7 /100 | #111 | Exceptional 75.9% |
| Immigrants | Canada | 95.6 /100 | #112 | Exceptional 75.9% |
| Immigrants | Netherlands | 95.3 /100 | #113 | Exceptional 75.9% |
| Immigrants | Zimbabwe | 95.1 /100 | #114 | Exceptional 75.9% |
| Alaska Natives | 95.1 /100 | #115 | Exceptional 75.9% |