Immigrants from England vs Immigrants from Ireland In Labor Force | Age 20-64
COMPARE
Immigrants from England
Immigrants from Ireland
In Labor Force | Age 20-64
In Labor Force | Age 20-64 Comparison
Immigrants from England
Immigrants from Ireland
79.2%
IN LABOR FORCE | AGE 20-64
9.3/ 100
METRIC RATING
218th/ 347
METRIC RANK
80.7%
IN LABOR FORCE | AGE 20-64
99.9/ 100
METRIC RATING
32nd/ 347
METRIC RANK
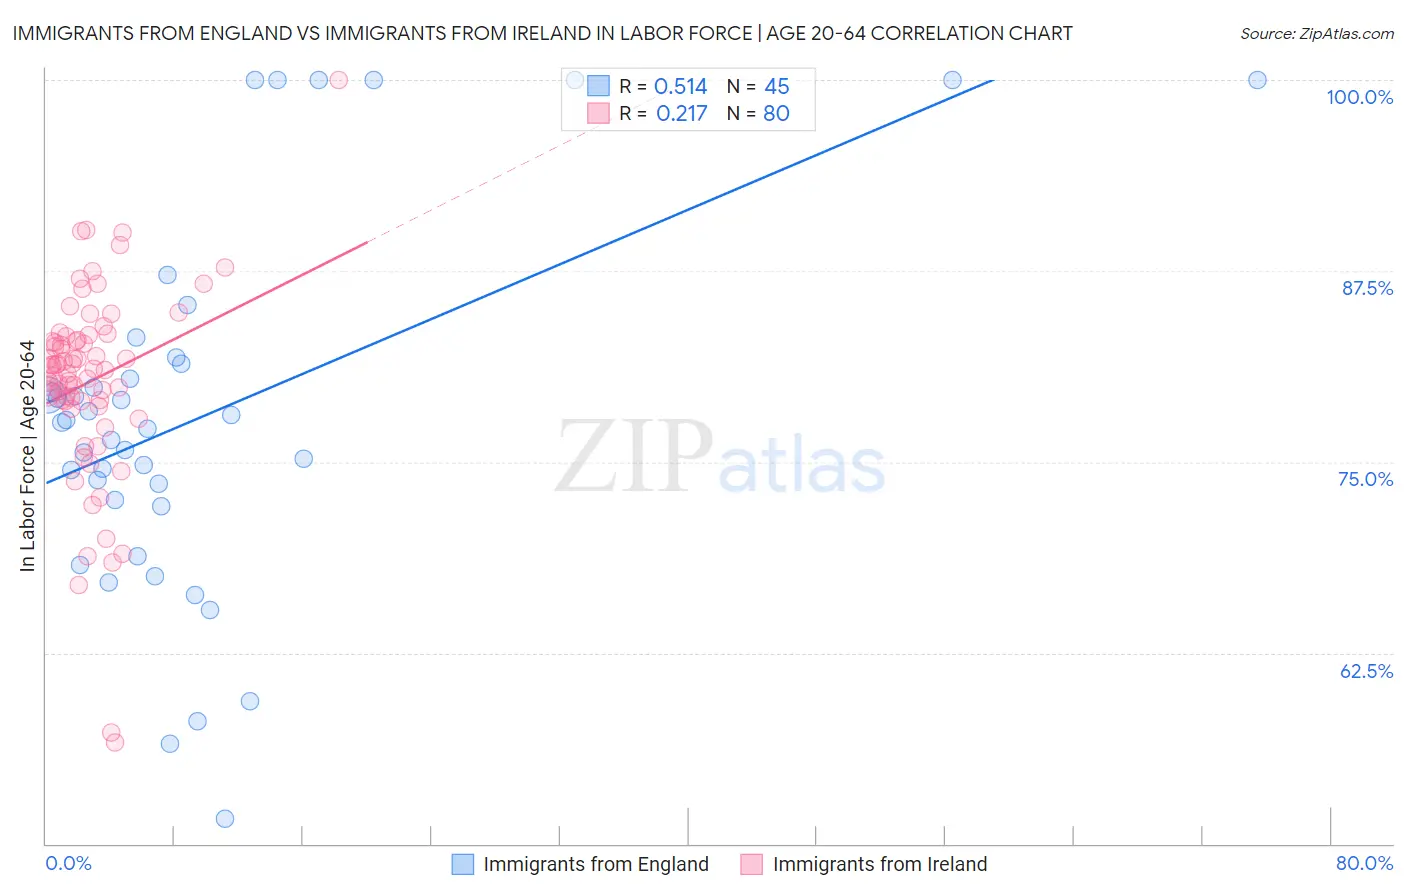
Immigrants from England vs Immigrants from Ireland In Labor Force | Age 20-64 Correlation Chart
The statistical analysis conducted on geographies consisting of 391,897,743 people shows a substantial positive correlation between the proportion of Immigrants from England and labor force participation rate among population between the ages 20 and 64 in the United States with a correlation coefficient (R) of 0.514 and weighted average of 79.2%. Similarly, the statistical analysis conducted on geographies consisting of 240,784,168 people shows a weak positive correlation between the proportion of Immigrants from Ireland and labor force participation rate among population between the ages 20 and 64 in the United States with a correlation coefficient (R) of 0.217 and weighted average of 80.7%, a difference of 1.9%.
In Labor Force | Age 20-64 Correlation Summary
| Measurement | Immigrants from England | Immigrants from Ireland |
| Minimum | 51.6% | 56.6% |
| Maximum | 100.0% | 100.0% |
| Range | 48.4% | 43.4% |
| Mean | 78.0% | 80.3% |
| Median | 77.6% | 81.1% |
| Interquartile 25% (IQ1) | 72.3% | 79.0% |
| Interquartile 75% (IQ3) | 81.6% | 83.1% |
| Interquartile Range (IQR) | 9.3% | 4.1% |
| Standard Deviation (Sample) | 12.0% | 6.5% |
| Standard Deviation (Population) | 11.9% | 6.4% |
Similar Demographics by In Labor Force | Age 20-64
Demographics Similar to Immigrants from England by In Labor Force | Age 20-64
In terms of in labor force | age 20-64, the demographic groups most similar to Immigrants from England are French Canadian (79.2%, a difference of 0.020%), Immigrants from Western Asia (79.2%, a difference of 0.040%), Immigrants (79.2%, a difference of 0.040%), Arab (79.2%, a difference of 0.050%), and Immigrants from Armenia (79.2%, a difference of 0.060%).
| Demographics | Rating | Rank | In Labor Force | Age 20-64 |
| Europeans | 15.3 /100 | #211 | Poor 79.3% |
| Irish | 13.2 /100 | #212 | Poor 79.3% |
| Immigrants | Portugal | 12.8 /100 | #213 | Poor 79.3% |
| Immigrants | Armenia | 12.2 /100 | #214 | Poor 79.2% |
| Immigrants | Norway | 12.0 /100 | #215 | Poor 79.2% |
| Arabs | 11.4 /100 | #216 | Poor 79.2% |
| Immigrants | Western Asia | 11.0 /100 | #217 | Poor 79.2% |
| Immigrants | England | 9.3 /100 | #218 | Tragic 79.2% |
| French Canadians | 8.4 /100 | #219 | Tragic 79.2% |
| Immigrants | Immigrants | 7.7 /100 | #220 | Tragic 79.2% |
| Hungarians | 7.2 /100 | #221 | Tragic 79.2% |
| Immigrants | Panama | 6.9 /100 | #222 | Tragic 79.1% |
| Canadians | 6.8 /100 | #223 | Tragic 79.1% |
| Immigrants | Uzbekistan | 6.8 /100 | #224 | Tragic 79.1% |
| Portuguese | 6.4 /100 | #225 | Tragic 79.1% |
Demographics Similar to Immigrants from Ireland by In Labor Force | Age 20-64
In terms of in labor force | age 20-64, the demographic groups most similar to Immigrants from Ireland are Immigrants from Lithuania (80.7%, a difference of 0.010%), Immigrants from South Central Asia (80.7%, a difference of 0.030%), Immigrants from North Macedonia (80.7%, a difference of 0.030%), Chinese (80.7%, a difference of 0.030%), and Immigrants from Uganda (80.7%, a difference of 0.050%).
| Demographics | Rating | Rank | In Labor Force | Age 20-64 |
| Kenyans | 100.0 /100 | #25 | Exceptional 80.8% |
| Immigrants | Serbia | 100.0 /100 | #26 | Exceptional 80.8% |
| Immigrants | Kenya | 99.9 /100 | #27 | Exceptional 80.7% |
| Immigrants | Uganda | 99.9 /100 | #28 | Exceptional 80.7% |
| Immigrants | South Central Asia | 99.9 /100 | #29 | Exceptional 80.7% |
| Immigrants | North Macedonia | 99.9 /100 | #30 | Exceptional 80.7% |
| Immigrants | Lithuania | 99.9 /100 | #31 | Exceptional 80.7% |
| Immigrants | Ireland | 99.9 /100 | #32 | Exceptional 80.7% |
| Chinese | 99.9 /100 | #33 | Exceptional 80.7% |
| Immigrants | Brazil | 99.9 /100 | #34 | Exceptional 80.7% |
| Immigrants | Poland | 99.9 /100 | #35 | Exceptional 80.6% |
| Paraguayans | 99.8 /100 | #36 | Exceptional 80.6% |
| Immigrants | Moldova | 99.8 /100 | #37 | Exceptional 80.6% |
| Ugandans | 99.8 /100 | #38 | Exceptional 80.6% |
| Brazilians | 99.8 /100 | #39 | Exceptional 80.5% |