Immigrants from England vs Chilean In Labor Force | Age 20-64
COMPARE
Immigrants from England
Chilean
In Labor Force | Age 20-64
In Labor Force | Age 20-64 Comparison
Immigrants from England
Chileans
79.2%
IN LABOR FORCE | AGE 20-64
9.3/ 100
METRIC RATING
218th/ 347
METRIC RANK
80.1%
IN LABOR FORCE | AGE 20-64
97.0/ 100
METRIC RATING
88th/ 347
METRIC RANK
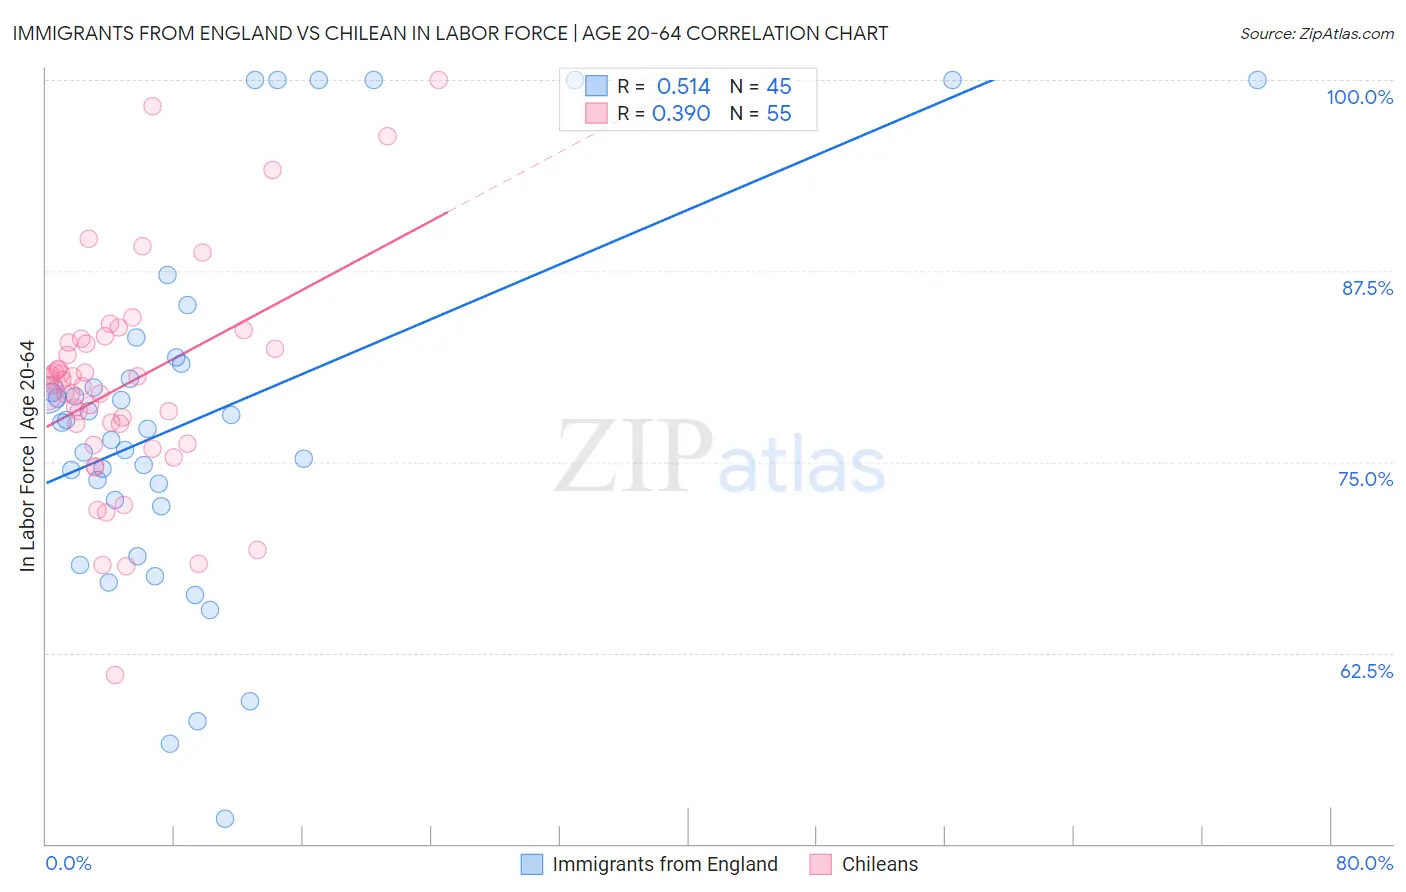
Immigrants from England vs Chilean In Labor Force | Age 20-64 Correlation Chart
The statistical analysis conducted on geographies consisting of 391,897,743 people shows a substantial positive correlation between the proportion of Immigrants from England and labor force participation rate among population between the ages 20 and 64 in the United States with a correlation coefficient (R) of 0.514 and weighted average of 79.2%. Similarly, the statistical analysis conducted on geographies consisting of 256,687,224 people shows a mild positive correlation between the proportion of Chileans and labor force participation rate among population between the ages 20 and 64 in the United States with a correlation coefficient (R) of 0.390 and weighted average of 80.1%, a difference of 1.2%.
In Labor Force | Age 20-64 Correlation Summary
| Measurement | Immigrants from England | Chilean |
| Minimum | 51.6% | 61.1% |
| Maximum | 100.0% | 100.0% |
| Range | 48.4% | 38.9% |
| Mean | 78.0% | 80.0% |
| Median | 77.6% | 80.0% |
| Interquartile 25% (IQ1) | 72.3% | 76.2% |
| Interquartile 75% (IQ3) | 81.6% | 82.8% |
| Interquartile Range (IQR) | 9.3% | 6.6% |
| Standard Deviation (Sample) | 12.0% | 7.2% |
| Standard Deviation (Population) | 11.9% | 7.1% |
Similar Demographics by In Labor Force | Age 20-64
Demographics Similar to Immigrants from England by In Labor Force | Age 20-64
In terms of in labor force | age 20-64, the demographic groups most similar to Immigrants from England are French Canadian (79.2%, a difference of 0.020%), Immigrants from Western Asia (79.2%, a difference of 0.040%), Immigrants (79.2%, a difference of 0.040%), Arab (79.2%, a difference of 0.050%), and Immigrants from Armenia (79.2%, a difference of 0.060%).
| Demographics | Rating | Rank | In Labor Force | Age 20-64 |
| Europeans | 15.3 /100 | #211 | Poor 79.3% |
| Irish | 13.2 /100 | #212 | Poor 79.3% |
| Immigrants | Portugal | 12.8 /100 | #213 | Poor 79.3% |
| Immigrants | Armenia | 12.2 /100 | #214 | Poor 79.2% |
| Immigrants | Norway | 12.0 /100 | #215 | Poor 79.2% |
| Arabs | 11.4 /100 | #216 | Poor 79.2% |
| Immigrants | Western Asia | 11.0 /100 | #217 | Poor 79.2% |
| Immigrants | England | 9.3 /100 | #218 | Tragic 79.2% |
| French Canadians | 8.4 /100 | #219 | Tragic 79.2% |
| Immigrants | Immigrants | 7.7 /100 | #220 | Tragic 79.2% |
| Hungarians | 7.2 /100 | #221 | Tragic 79.2% |
| Immigrants | Panama | 6.9 /100 | #222 | Tragic 79.1% |
| Canadians | 6.8 /100 | #223 | Tragic 79.1% |
| Immigrants | Uzbekistan | 6.8 /100 | #224 | Tragic 79.1% |
| Portuguese | 6.4 /100 | #225 | Tragic 79.1% |
Demographics Similar to Chileans by In Labor Force | Age 20-64
In terms of in labor force | age 20-64, the demographic groups most similar to Chileans are Jordanian (80.1%, a difference of 0.010%), Immigrants from Egypt (80.1%, a difference of 0.010%), Croatian (80.1%, a difference of 0.010%), Immigrants from Venezuela (80.1%, a difference of 0.010%), and Polish (80.1%, a difference of 0.010%).
| Demographics | Rating | Rank | In Labor Force | Age 20-64 |
| German Russians | 97.3 /100 | #81 | Exceptional 80.1% |
| Immigrants | Japan | 97.3 /100 | #82 | Exceptional 80.1% |
| Colombians | 97.3 /100 | #83 | Exceptional 80.1% |
| Immigrants | Latvia | 97.2 /100 | #84 | Exceptional 80.1% |
| Jordanians | 97.2 /100 | #85 | Exceptional 80.1% |
| Immigrants | Egypt | 97.1 /100 | #86 | Exceptional 80.1% |
| Croatians | 97.1 /100 | #87 | Exceptional 80.1% |
| Chileans | 97.0 /100 | #88 | Exceptional 80.1% |
| Immigrants | Venezuela | 96.8 /100 | #89 | Exceptional 80.1% |
| Poles | 96.8 /100 | #90 | Exceptional 80.1% |
| Uruguayans | 96.7 /100 | #91 | Exceptional 80.1% |
| Ghanaians | 96.7 /100 | #92 | Exceptional 80.1% |
| Immigrants | Belarus | 96.4 /100 | #93 | Exceptional 80.1% |
| Immigrants | Asia | 96.0 /100 | #94 | Exceptional 80.1% |
| Yugoslavians | 95.9 /100 | #95 | Exceptional 80.1% |