Mexican American Indian vs Immigrants from Kuwait In Labor Force | Age 20-64
COMPARE
Mexican American Indian
Immigrants from Kuwait
In Labor Force | Age 20-64
In Labor Force | Age 20-64 Comparison
Mexican American Indians
Immigrants from Kuwait
78.2%
IN LABOR FORCE | AGE 20-64
0.0/ 100
METRIC RATING
278th/ 347
METRIC RANK
80.0%
IN LABOR FORCE | AGE 20-64
92.2/ 100
METRIC RATING
121st/ 347
METRIC RANK
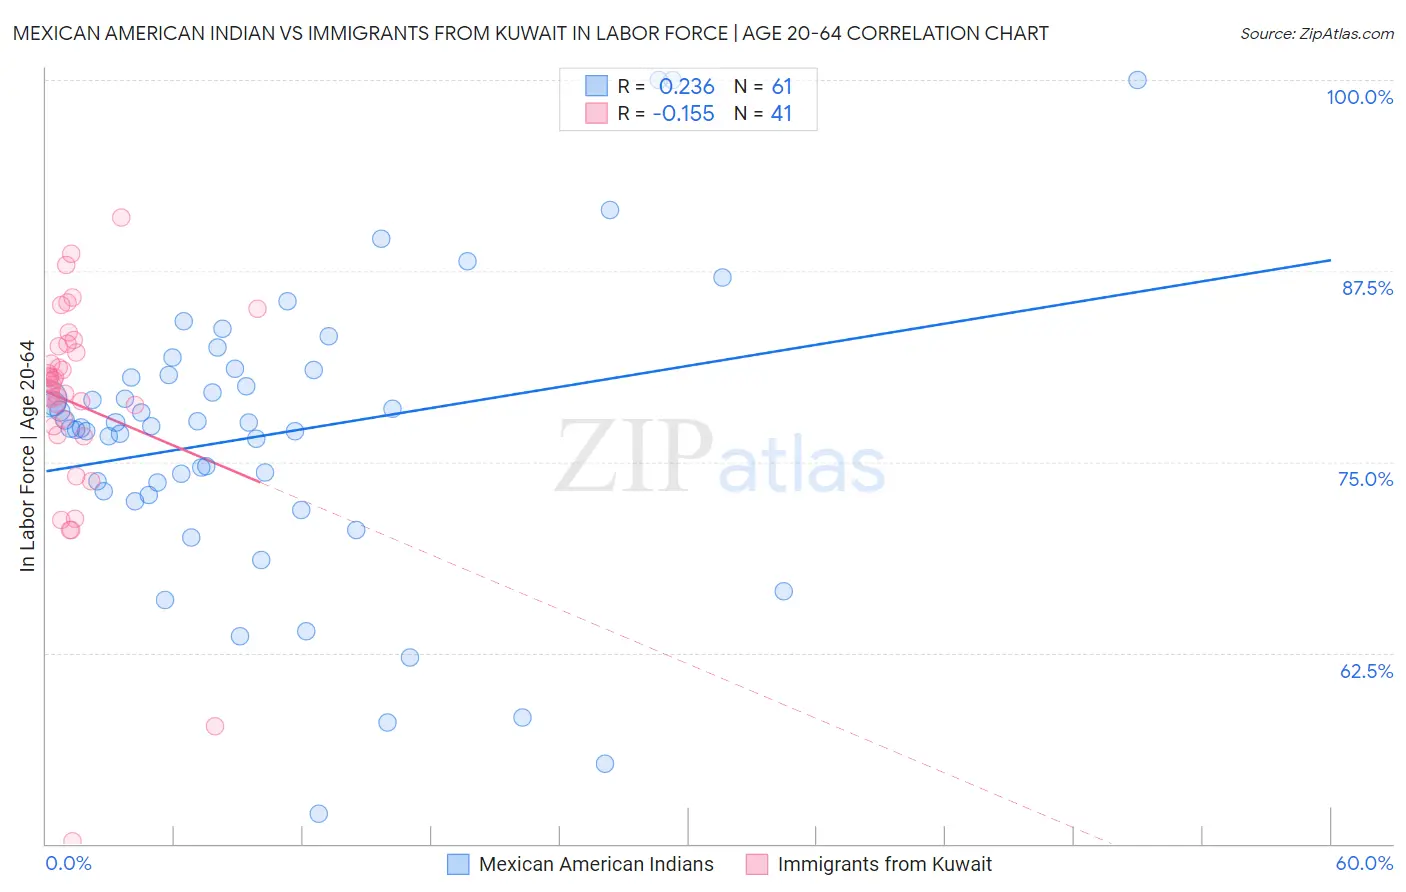
Mexican American Indian vs Immigrants from Kuwait In Labor Force | Age 20-64 Correlation Chart
The statistical analysis conducted on geographies consisting of 317,601,754 people shows a weak positive correlation between the proportion of Mexican American Indians and labor force participation rate among population between the ages 20 and 64 in the United States with a correlation coefficient (R) of 0.236 and weighted average of 78.2%. Similarly, the statistical analysis conducted on geographies consisting of 136,914,961 people shows a poor negative correlation between the proportion of Immigrants from Kuwait and labor force participation rate among population between the ages 20 and 64 in the United States with a correlation coefficient (R) of -0.155 and weighted average of 80.0%, a difference of 2.2%.
In Labor Force | Age 20-64 Correlation Summary
| Measurement | Mexican American Indian | Immigrants from Kuwait |
| Minimum | 52.0% | 50.2% |
| Maximum | 100.0% | 91.0% |
| Range | 48.0% | 40.8% |
| Mean | 76.8% | 78.8% |
| Median | 77.3% | 80.2% |
| Interquartile 25% (IQ1) | 73.0% | 77.0% |
| Interquartile 75% (IQ3) | 80.9% | 82.7% |
| Interquartile Range (IQR) | 7.9% | 5.7% |
| Standard Deviation (Sample) | 9.5% | 7.4% |
| Standard Deviation (Population) | 9.4% | 7.3% |
Similar Demographics by In Labor Force | Age 20-64
Demographics Similar to Mexican American Indians by In Labor Force | Age 20-64
In terms of in labor force | age 20-64, the demographic groups most similar to Mexican American Indians are Immigrants from Bahamas (78.2%, a difference of 0.0%), Spanish (78.2%, a difference of 0.020%), Puget Sound Salish (78.2%, a difference of 0.020%), Aleut (78.2%, a difference of 0.030%), and French American Indian (78.2%, a difference of 0.050%).
| Demographics | Rating | Rank | In Labor Force | Age 20-64 |
| Immigrants | Latin America | 0.0 /100 | #271 | Tragic 78.3% |
| Marshallese | 0.0 /100 | #272 | Tragic 78.3% |
| French American Indians | 0.0 /100 | #273 | Tragic 78.2% |
| Aleuts | 0.0 /100 | #274 | Tragic 78.2% |
| Spanish | 0.0 /100 | #275 | Tragic 78.2% |
| Puget Sound Salish | 0.0 /100 | #276 | Tragic 78.2% |
| Immigrants | Bahamas | 0.0 /100 | #277 | Tragic 78.2% |
| Mexican American Indians | 0.0 /100 | #278 | Tragic 78.2% |
| Belizeans | 0.0 /100 | #279 | Tragic 78.2% |
| Immigrants | Dominica | 0.0 /100 | #280 | Tragic 78.1% |
| Guyanese | 0.0 /100 | #281 | Tragic 78.1% |
| Immigrants | St. Vincent and the Grenadines | 0.0 /100 | #282 | Tragic 78.1% |
| Immigrants | Nonimmigrants | 0.0 /100 | #283 | Tragic 78.1% |
| Immigrants | Guyana | 0.0 /100 | #284 | Tragic 78.1% |
| Osage | 0.0 /100 | #285 | Tragic 78.0% |
Demographics Similar to Immigrants from Kuwait by In Labor Force | Age 20-64
In terms of in labor force | age 20-64, the demographic groups most similar to Immigrants from Kuwait are Immigrants from Vietnam (80.0%, a difference of 0.010%), Cape Verdean (80.0%, a difference of 0.010%), Immigrants from Taiwan (80.0%, a difference of 0.010%), Maltese (80.0%, a difference of 0.010%), and Mongolian (79.9%, a difference of 0.010%).
| Demographics | Rating | Rank | In Labor Force | Age 20-64 |
| Argentineans | 93.8 /100 | #114 | Exceptional 80.0% |
| Bermudans | 93.3 /100 | #115 | Exceptional 80.0% |
| Immigrants | Western Africa | 93.1 /100 | #116 | Exceptional 80.0% |
| Immigrants | Vietnam | 92.7 /100 | #117 | Exceptional 80.0% |
| Cape Verdeans | 92.7 /100 | #118 | Exceptional 80.0% |
| Immigrants | Taiwan | 92.5 /100 | #119 | Exceptional 80.0% |
| Maltese | 92.4 /100 | #120 | Exceptional 80.0% |
| Immigrants | Kuwait | 92.2 /100 | #121 | Exceptional 80.0% |
| Mongolians | 92.0 /100 | #122 | Exceptional 79.9% |
| Immigrants | Russia | 91.8 /100 | #123 | Exceptional 79.9% |
| Immigrants | Europe | 91.6 /100 | #124 | Exceptional 79.9% |
| Danes | 91.5 /100 | #125 | Exceptional 79.9% |
| Immigrants | France | 90.7 /100 | #126 | Exceptional 79.9% |
| Immigrants | Czechoslovakia | 89.7 /100 | #127 | Excellent 79.9% |
| Immigrants | Eastern Asia | 89.4 /100 | #128 | Excellent 79.9% |