Shoshone vs Chilean In Labor Force | Age 20-64
COMPARE
Shoshone
Chilean
In Labor Force | Age 20-64
In Labor Force | Age 20-64 Comparison
Shoshone
Chileans
76.8%
IN LABOR FORCE | AGE 20-64
0.0/ 100
METRIC RATING
313th/ 347
METRIC RANK
80.1%
IN LABOR FORCE | AGE 20-64
97.0/ 100
METRIC RATING
88th/ 347
METRIC RANK
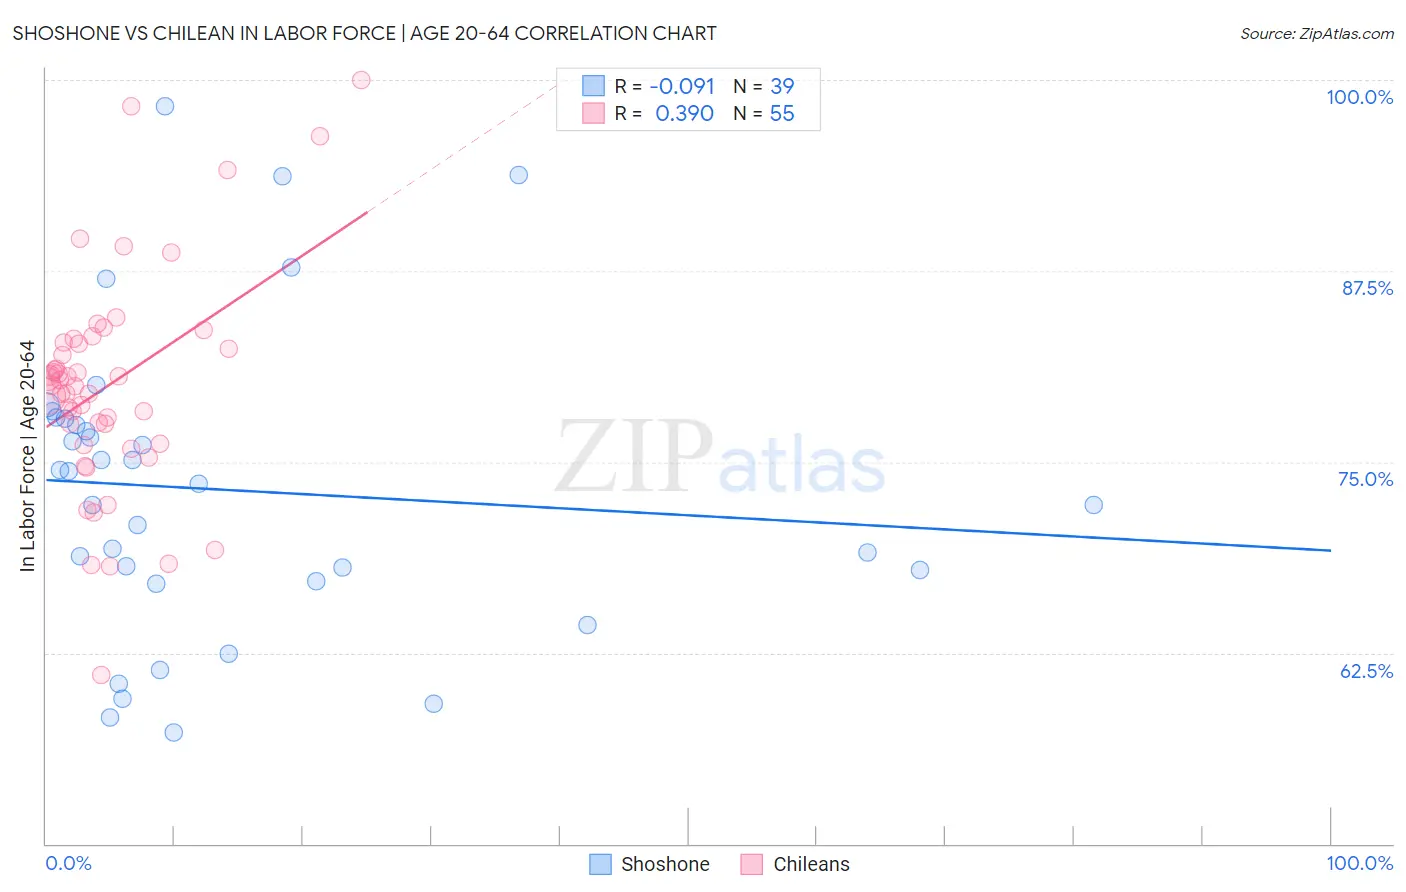
Shoshone vs Chilean In Labor Force | Age 20-64 Correlation Chart
The statistical analysis conducted on geographies consisting of 66,627,303 people shows a slight negative correlation between the proportion of Shoshone and labor force participation rate among population between the ages 20 and 64 in the United States with a correlation coefficient (R) of -0.091 and weighted average of 76.8%. Similarly, the statistical analysis conducted on geographies consisting of 256,687,224 people shows a mild positive correlation between the proportion of Chileans and labor force participation rate among population between the ages 20 and 64 in the United States with a correlation coefficient (R) of 0.390 and weighted average of 80.1%, a difference of 4.3%.
In Labor Force | Age 20-64 Correlation Summary
| Measurement | Shoshone | Chilean |
| Minimum | 57.3% | 61.1% |
| Maximum | 98.3% | 100.0% |
| Range | 41.0% | 38.9% |
| Mean | 73.2% | 80.0% |
| Median | 73.6% | 80.0% |
| Interquartile 25% (IQ1) | 67.2% | 76.2% |
| Interquartile 75% (IQ3) | 77.8% | 82.8% |
| Interquartile Range (IQR) | 10.6% | 6.6% |
| Standard Deviation (Sample) | 9.8% | 7.2% |
| Standard Deviation (Population) | 9.7% | 7.1% |
Similar Demographics by In Labor Force | Age 20-64
Demographics Similar to Shoshone by In Labor Force | Age 20-64
In terms of in labor force | age 20-64, the demographic groups most similar to Shoshone are Black/African American (76.8%, a difference of 0.020%), Alaskan Athabascan (76.9%, a difference of 0.12%), Ottawa (76.7%, a difference of 0.12%), Blackfeet (77.0%, a difference of 0.29%), and Yaqui (76.5%, a difference of 0.31%).
| Demographics | Rating | Rank | In Labor Force | Age 20-64 |
| Potawatomi | 0.0 /100 | #306 | Tragic 77.2% |
| Central American Indians | 0.0 /100 | #307 | Tragic 77.1% |
| Alaska Natives | 0.0 /100 | #308 | Tragic 77.0% |
| Americans | 0.0 /100 | #309 | Tragic 77.0% |
| Comanche | 0.0 /100 | #310 | Tragic 77.0% |
| Blackfeet | 0.0 /100 | #311 | Tragic 77.0% |
| Alaskan Athabascans | 0.0 /100 | #312 | Tragic 76.9% |
| Shoshone | 0.0 /100 | #313 | Tragic 76.8% |
| Blacks/African Americans | 0.0 /100 | #314 | Tragic 76.8% |
| Ottawa | 0.0 /100 | #315 | Tragic 76.7% |
| Yaqui | 0.0 /100 | #316 | Tragic 76.5% |
| Cherokee | 0.0 /100 | #317 | Tragic 76.2% |
| Chickasaw | 0.0 /100 | #318 | Tragic 76.2% |
| Inupiat | 0.0 /100 | #319 | Tragic 76.1% |
| Yakama | 0.0 /100 | #320 | Tragic 75.8% |
Demographics Similar to Chileans by In Labor Force | Age 20-64
In terms of in labor force | age 20-64, the demographic groups most similar to Chileans are Jordanian (80.1%, a difference of 0.010%), Immigrants from Egypt (80.1%, a difference of 0.010%), Croatian (80.1%, a difference of 0.010%), Immigrants from Venezuela (80.1%, a difference of 0.010%), and Polish (80.1%, a difference of 0.010%).
| Demographics | Rating | Rank | In Labor Force | Age 20-64 |
| German Russians | 97.3 /100 | #81 | Exceptional 80.1% |
| Immigrants | Japan | 97.3 /100 | #82 | Exceptional 80.1% |
| Colombians | 97.3 /100 | #83 | Exceptional 80.1% |
| Immigrants | Latvia | 97.2 /100 | #84 | Exceptional 80.1% |
| Jordanians | 97.2 /100 | #85 | Exceptional 80.1% |
| Immigrants | Egypt | 97.1 /100 | #86 | Exceptional 80.1% |
| Croatians | 97.1 /100 | #87 | Exceptional 80.1% |
| Chileans | 97.0 /100 | #88 | Exceptional 80.1% |
| Immigrants | Venezuela | 96.8 /100 | #89 | Exceptional 80.1% |
| Poles | 96.8 /100 | #90 | Exceptional 80.1% |
| Uruguayans | 96.7 /100 | #91 | Exceptional 80.1% |
| Ghanaians | 96.7 /100 | #92 | Exceptional 80.1% |
| Immigrants | Belarus | 96.4 /100 | #93 | Exceptional 80.1% |
| Immigrants | Asia | 96.0 /100 | #94 | Exceptional 80.1% |
| Yugoslavians | 95.9 /100 | #95 | Exceptional 80.1% |