Immigrants from England vs Immigrants from Portugal In Labor Force | Age 45-54
COMPARE
Immigrants from England
Immigrants from Portugal
In Labor Force | Age 45-54
In Labor Force | Age 45-54 Comparison
Immigrants from England
Immigrants from Portugal
82.6%
IN LABOR FORCE | AGE 45-54
32.2/ 100
METRIC RATING
185th/ 347
METRIC RANK
82.0%
IN LABOR FORCE | AGE 45-54
1.7/ 100
METRIC RATING
232nd/ 347
METRIC RANK
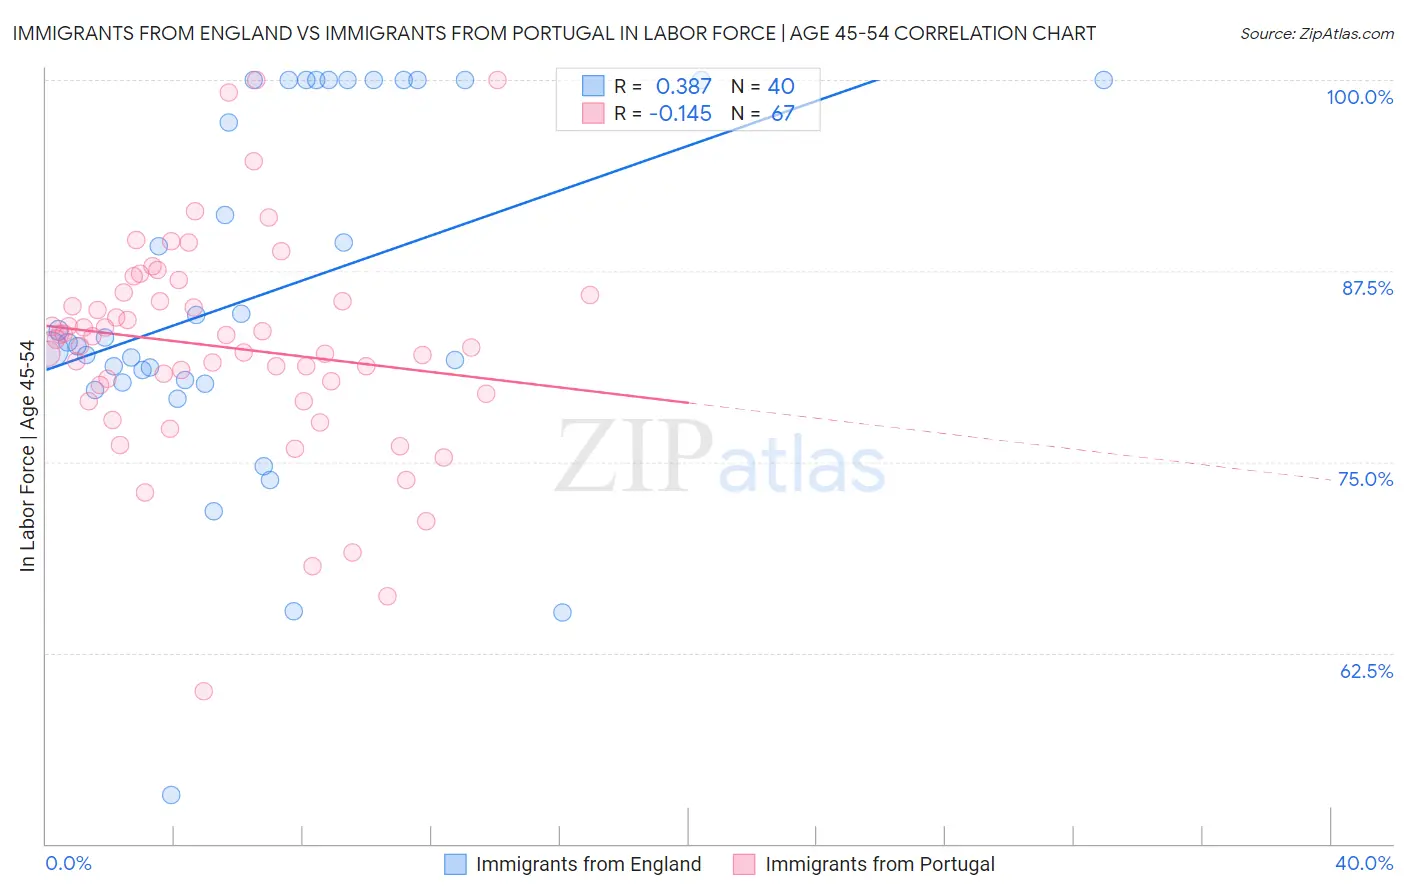
Immigrants from England vs Immigrants from Portugal In Labor Force | Age 45-54 Correlation Chart
The statistical analysis conducted on geographies consisting of 391,754,250 people shows a mild positive correlation between the proportion of Immigrants from England and labor force participation rate among population between the ages 45 and 54 in the United States with a correlation coefficient (R) of 0.387 and weighted average of 82.6%. Similarly, the statistical analysis conducted on geographies consisting of 174,762,889 people shows a poor negative correlation between the proportion of Immigrants from Portugal and labor force participation rate among population between the ages 45 and 54 in the United States with a correlation coefficient (R) of -0.145 and weighted average of 82.0%, a difference of 0.74%.
In Labor Force | Age 45-54 Correlation Summary
| Measurement | Immigrants from England | Immigrants from Portugal |
| Minimum | 53.2% | 60.0% |
| Maximum | 100.0% | 100.0% |
| Range | 46.8% | 40.0% |
| Mean | 86.1% | 82.5% |
| Median | 83.0% | 83.0% |
| Interquartile 25% (IQ1) | 80.3% | 79.5% |
| Interquartile 75% (IQ3) | 100.0% | 85.9% |
| Interquartile Range (IQR) | 19.7% | 6.4% |
| Standard Deviation (Sample) | 11.7% | 7.1% |
| Standard Deviation (Population) | 11.5% | 7.1% |
Similar Demographics by In Labor Force | Age 45-54
Demographics Similar to Immigrants from England by In Labor Force | Age 45-54
In terms of in labor force | age 45-54, the demographic groups most similar to Immigrants from England are New Zealander (82.6%, a difference of 0.0%), European (82.6%, a difference of 0.0%), Irish (82.6%, a difference of 0.030%), Immigrants from Costa Rica (82.6%, a difference of 0.040%), and South African (82.6%, a difference of 0.040%).
| Demographics | Rating | Rank | In Labor Force | Age 45-54 |
| Nigerians | 40.5 /100 | #178 | Average 82.7% |
| Immigrants | Switzerland | 39.4 /100 | #179 | Fair 82.7% |
| Hungarians | 38.0 /100 | #180 | Fair 82.7% |
| Israelis | 37.7 /100 | #181 | Fair 82.7% |
| Immigrants | Hungary | 37.1 /100 | #182 | Fair 82.7% |
| New Zealanders | 32.7 /100 | #183 | Fair 82.6% |
| Europeans | 32.6 /100 | #184 | Fair 82.6% |
| Immigrants | England | 32.2 /100 | #185 | Fair 82.6% |
| Irish | 29.2 /100 | #186 | Fair 82.6% |
| Immigrants | Costa Rica | 28.3 /100 | #187 | Fair 82.6% |
| South Africans | 28.0 /100 | #188 | Fair 82.6% |
| Syrians | 26.0 /100 | #189 | Fair 82.6% |
| British | 25.7 /100 | #190 | Fair 82.6% |
| Armenians | 23.2 /100 | #191 | Fair 82.5% |
| Immigrants | Iraq | 20.9 /100 | #192 | Fair 82.5% |
Demographics Similar to Immigrants from Portugal by In Labor Force | Age 45-54
In terms of in labor force | age 45-54, the demographic groups most similar to Immigrants from Portugal are Immigrants from Senegal (82.0%, a difference of 0.0%), Malaysian (82.0%, a difference of 0.0%), Salvadoran (82.0%, a difference of 0.0%), Jamaican (82.0%, a difference of 0.020%), and Immigrants from Burma/Myanmar (82.0%, a difference of 0.030%).
| Demographics | Rating | Rank | In Labor Force | Age 45-54 |
| Immigrants | Oceania | 2.5 /100 | #225 | Tragic 82.1% |
| Immigrants | Caribbean | 2.5 /100 | #226 | Tragic 82.1% |
| Immigrants | Germany | 2.4 /100 | #227 | Tragic 82.1% |
| Cape Verdeans | 2.1 /100 | #228 | Tragic 82.1% |
| Immigrants | Burma/Myanmar | 1.9 /100 | #229 | Tragic 82.0% |
| Jamaicans | 1.8 /100 | #230 | Tragic 82.0% |
| Immigrants | Senegal | 1.7 /100 | #231 | Tragic 82.0% |
| Immigrants | Portugal | 1.7 /100 | #232 | Tragic 82.0% |
| Malaysians | 1.7 /100 | #233 | Tragic 82.0% |
| Salvadorans | 1.7 /100 | #234 | Tragic 82.0% |
| Sub-Saharan Africans | 1.2 /100 | #235 | Tragic 82.0% |
| Basques | 1.2 /100 | #236 | Tragic 82.0% |
| Immigrants | Trinidad and Tobago | 1.2 /100 | #237 | Tragic 82.0% |
| Trinidadians and Tobagonians | 1.1 /100 | #238 | Tragic 81.9% |
| Immigrants | Thailand | 1.0 /100 | #239 | Tragic 81.9% |