Ghanaian vs British West Indian In Labor Force | Age 45-54
COMPARE
Ghanaian
British West Indian
In Labor Force | Age 45-54
In Labor Force | Age 45-54 Comparison
Ghanaians
British West Indians
83.0%
IN LABOR FORCE | AGE 45-54
79.5/ 100
METRIC RATING
138th/ 347
METRIC RANK
81.2%
IN LABOR FORCE | AGE 45-54
0.0/ 100
METRIC RATING
274th/ 347
METRIC RANK
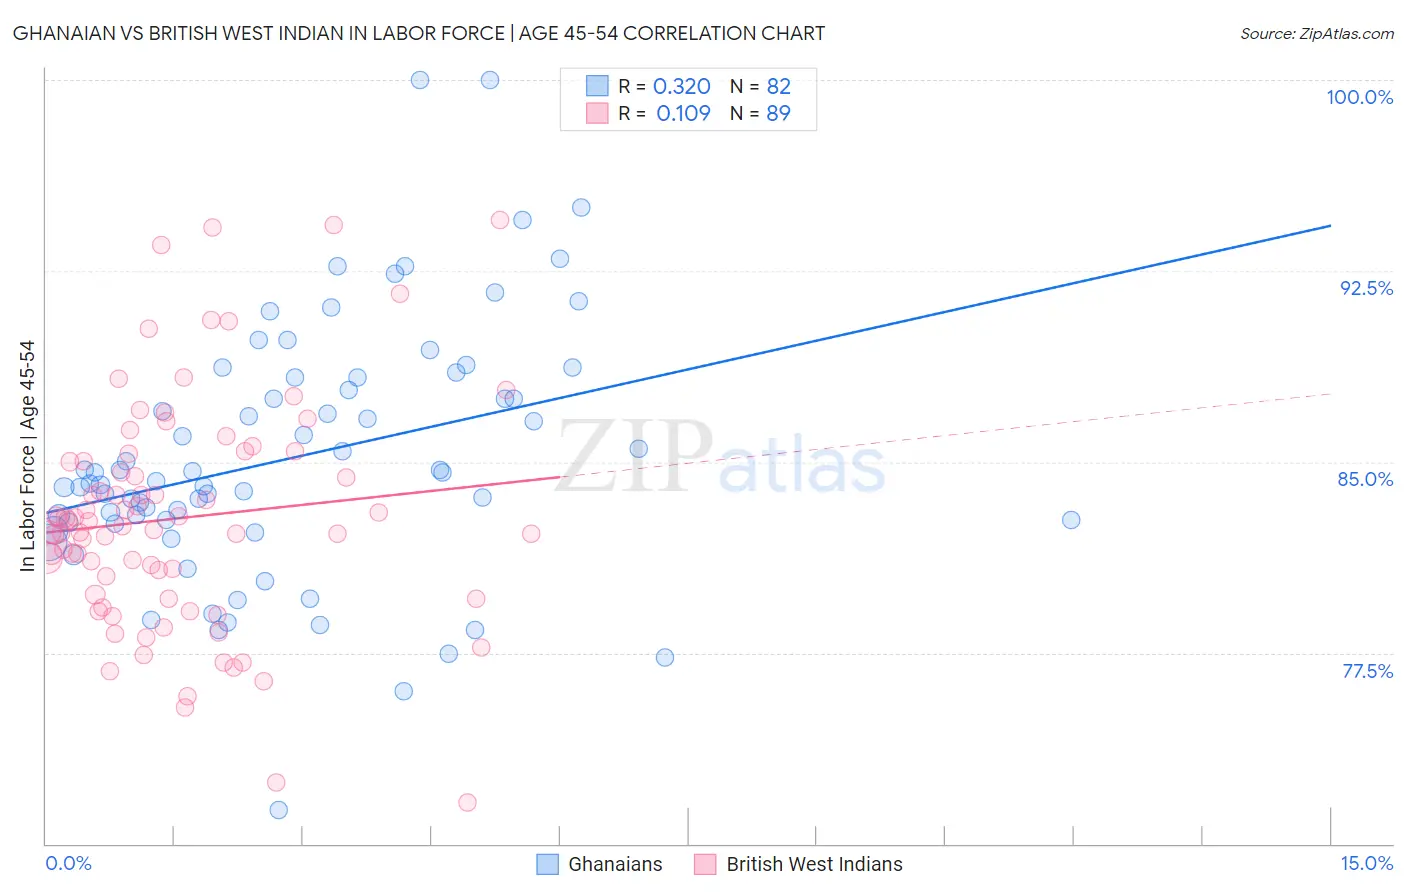
Ghanaian vs British West Indian In Labor Force | Age 45-54 Correlation Chart
The statistical analysis conducted on geographies consisting of 190,513,604 people shows a mild positive correlation between the proportion of Ghanaians and labor force participation rate among population between the ages 45 and 54 in the United States with a correlation coefficient (R) of 0.320 and weighted average of 83.0%. Similarly, the statistical analysis conducted on geographies consisting of 152,595,623 people shows a poor positive correlation between the proportion of British West Indians and labor force participation rate among population between the ages 45 and 54 in the United States with a correlation coefficient (R) of 0.109 and weighted average of 81.2%, a difference of 2.2%.
In Labor Force | Age 45-54 Correlation Summary
| Measurement | Ghanaian | British West Indian |
| Minimum | 71.3% | 71.6% |
| Maximum | 100.0% | 94.5% |
| Range | 28.7% | 22.9% |
| Mean | 85.2% | 82.8% |
| Median | 84.4% | 82.5% |
| Interquartile 25% (IQ1) | 82.6% | 79.7% |
| Interquartile 75% (IQ3) | 88.3% | 85.2% |
| Interquartile Range (IQR) | 5.7% | 5.5% |
| Standard Deviation (Sample) | 5.0% | 4.5% |
| Standard Deviation (Population) | 5.0% | 4.5% |
Similar Demographics by In Labor Force | Age 45-54
Demographics Similar to Ghanaians by In Labor Force | Age 45-54
In terms of in labor force | age 45-54, the demographic groups most similar to Ghanaians are Immigrants from Spain (83.0%, a difference of 0.010%), Scandinavian (83.0%, a difference of 0.010%), Austrian (83.0%, a difference of 0.020%), Immigrants from Kazakhstan (83.0%, a difference of 0.020%), and Yugoslavian (83.0%, a difference of 0.020%).
| Demographics | Rating | Rank | In Labor Force | Age 45-54 |
| Finns | 83.3 /100 | #131 | Excellent 83.1% |
| Immigrants | Ukraine | 82.9 /100 | #132 | Excellent 83.0% |
| Liberians | 82.7 /100 | #133 | Excellent 83.0% |
| Sudanese | 82.0 /100 | #134 | Excellent 83.0% |
| Austrians | 81.3 /100 | #135 | Excellent 83.0% |
| Immigrants | Kazakhstan | 81.0 /100 | #136 | Excellent 83.0% |
| Immigrants | Spain | 80.4 /100 | #137 | Excellent 83.0% |
| Ghanaians | 79.5 /100 | #138 | Good 83.0% |
| Scandinavians | 78.5 /100 | #139 | Good 83.0% |
| Yugoslavians | 78.3 /100 | #140 | Good 83.0% |
| Immigrants | Haiti | 77.9 /100 | #141 | Good 83.0% |
| Immigrants | Scotland | 77.8 /100 | #142 | Good 83.0% |
| Okinawans | 77.0 /100 | #143 | Good 83.0% |
| Soviet Union | 76.8 /100 | #144 | Good 83.0% |
| Romanians | 75.4 /100 | #145 | Good 83.0% |
Demographics Similar to British West Indians by In Labor Force | Age 45-54
In terms of in labor force | age 45-54, the demographic groups most similar to British West Indians are Nonimmigrants (81.2%, a difference of 0.010%), Chippewa (81.3%, a difference of 0.030%), U.S. Virgin Islander (81.2%, a difference of 0.050%), Guatemalan (81.2%, a difference of 0.070%), and Immigrants from Barbados (81.3%, a difference of 0.10%).
| Demographics | Rating | Rank | In Labor Force | Age 45-54 |
| West Indians | 0.1 /100 | #267 | Tragic 81.4% |
| Immigrants | Honduras | 0.0 /100 | #268 | Tragic 81.4% |
| Alsatians | 0.0 /100 | #269 | Tragic 81.3% |
| Bangladeshis | 0.0 /100 | #270 | Tragic 81.3% |
| Immigrants | Barbados | 0.0 /100 | #271 | Tragic 81.3% |
| Spanish | 0.0 /100 | #272 | Tragic 81.3% |
| Chippewa | 0.0 /100 | #273 | Tragic 81.3% |
| British West Indians | 0.0 /100 | #274 | Tragic 81.2% |
| Immigrants | Nonimmigrants | 0.0 /100 | #275 | Tragic 81.2% |
| U.S. Virgin Islanders | 0.0 /100 | #276 | Tragic 81.2% |
| Guatemalans | 0.0 /100 | #277 | Tragic 81.2% |
| Immigrants | Guatemala | 0.0 /100 | #278 | Tragic 81.1% |
| Immigrants | Micronesia | 0.0 /100 | #279 | Tragic 81.1% |
| Immigrants | Latin America | 0.0 /100 | #280 | Tragic 81.0% |
| Immigrants | Grenada | 0.0 /100 | #281 | Tragic 81.0% |