Immigrants from England vs Colville In Labor Force | Age 45-54
COMPARE
Immigrants from England
Colville
In Labor Force | Age 45-54
In Labor Force | Age 45-54 Comparison
Immigrants from England
Colville
82.6%
IN LABOR FORCE | AGE 45-54
32.2/ 100
METRIC RATING
185th/ 347
METRIC RANK
79.5%
IN LABOR FORCE | AGE 45-54
0.0/ 100
METRIC RATING
313th/ 347
METRIC RANK
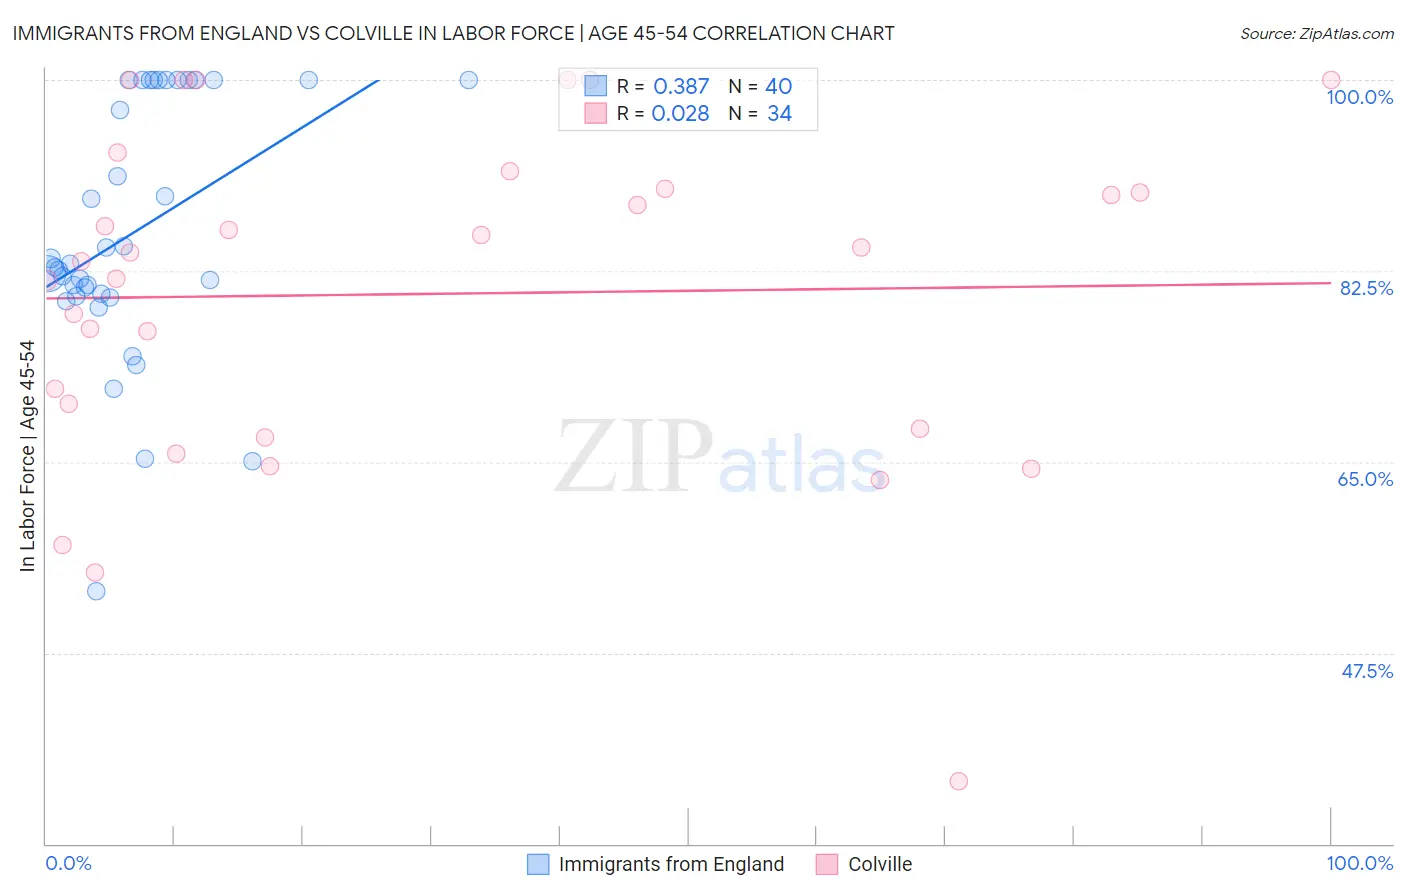
Immigrants from England vs Colville In Labor Force | Age 45-54 Correlation Chart
The statistical analysis conducted on geographies consisting of 391,754,250 people shows a mild positive correlation between the proportion of Immigrants from England and labor force participation rate among population between the ages 45 and 54 in the United States with a correlation coefficient (R) of 0.387 and weighted average of 82.6%. Similarly, the statistical analysis conducted on geographies consisting of 34,682,093 people shows no correlation between the proportion of Colville and labor force participation rate among population between the ages 45 and 54 in the United States with a correlation coefficient (R) of 0.028 and weighted average of 79.5%, a difference of 4.0%.
In Labor Force | Age 45-54 Correlation Summary
| Measurement | Immigrants from England | Colville |
| Minimum | 53.2% | 35.7% |
| Maximum | 100.0% | 100.0% |
| Range | 46.8% | 64.3% |
| Mean | 86.1% | 80.4% |
| Median | 83.0% | 83.8% |
| Interquartile 25% (IQ1) | 80.3% | 68.0% |
| Interquartile 75% (IQ3) | 100.0% | 90.0% |
| Interquartile Range (IQR) | 19.7% | 22.0% |
| Standard Deviation (Sample) | 11.7% | 15.4% |
| Standard Deviation (Population) | 11.5% | 15.1% |
Similar Demographics by In Labor Force | Age 45-54
Demographics Similar to Immigrants from England by In Labor Force | Age 45-54
In terms of in labor force | age 45-54, the demographic groups most similar to Immigrants from England are New Zealander (82.6%, a difference of 0.0%), European (82.6%, a difference of 0.0%), Irish (82.6%, a difference of 0.030%), Immigrants from Costa Rica (82.6%, a difference of 0.040%), and South African (82.6%, a difference of 0.040%).
| Demographics | Rating | Rank | In Labor Force | Age 45-54 |
| Nigerians | 40.5 /100 | #178 | Average 82.7% |
| Immigrants | Switzerland | 39.4 /100 | #179 | Fair 82.7% |
| Hungarians | 38.0 /100 | #180 | Fair 82.7% |
| Israelis | 37.7 /100 | #181 | Fair 82.7% |
| Immigrants | Hungary | 37.1 /100 | #182 | Fair 82.7% |
| New Zealanders | 32.7 /100 | #183 | Fair 82.6% |
| Europeans | 32.6 /100 | #184 | Fair 82.6% |
| Immigrants | England | 32.2 /100 | #185 | Fair 82.6% |
| Irish | 29.2 /100 | #186 | Fair 82.6% |
| Immigrants | Costa Rica | 28.3 /100 | #187 | Fair 82.6% |
| South Africans | 28.0 /100 | #188 | Fair 82.6% |
| Syrians | 26.0 /100 | #189 | Fair 82.6% |
| British | 25.7 /100 | #190 | Fair 82.6% |
| Armenians | 23.2 /100 | #191 | Fair 82.5% |
| Immigrants | Iraq | 20.9 /100 | #192 | Fair 82.5% |
Demographics Similar to Colville by In Labor Force | Age 45-54
In terms of in labor force | age 45-54, the demographic groups most similar to Colville are Ottawa (79.5%, a difference of 0.040%), Black/African American (79.3%, a difference of 0.17%), Immigrants from Mexico (79.7%, a difference of 0.24%), Shoshone (79.3%, a difference of 0.26%), and Mexican (79.8%, a difference of 0.39%).
| Demographics | Rating | Rank | In Labor Force | Age 45-54 |
| Spanish Americans | 0.0 /100 | #306 | Tragic 80.1% |
| Blackfeet | 0.0 /100 | #307 | Tragic 80.0% |
| Central American Indians | 0.0 /100 | #308 | Tragic 80.0% |
| Potawatomi | 0.0 /100 | #309 | Tragic 80.0% |
| Inupiat | 0.0 /100 | #310 | Tragic 79.9% |
| Mexicans | 0.0 /100 | #311 | Tragic 79.8% |
| Immigrants | Mexico | 0.0 /100 | #312 | Tragic 79.7% |
| Colville | 0.0 /100 | #313 | Tragic 79.5% |
| Ottawa | 0.0 /100 | #314 | Tragic 79.5% |
| Blacks/African Americans | 0.0 /100 | #315 | Tragic 79.3% |
| Shoshone | 0.0 /100 | #316 | Tragic 79.3% |
| Comanche | 0.0 /100 | #317 | Tragic 79.2% |
| Chickasaw | 0.0 /100 | #318 | Tragic 79.0% |
| Cherokee | 0.0 /100 | #319 | Tragic 79.0% |
| Yaqui | 0.0 /100 | #320 | Tragic 78.9% |