Arapaho vs British West Indian In Labor Force | Age 45-54
COMPARE
Arapaho
British West Indian
In Labor Force | Age 45-54
In Labor Force | Age 45-54 Comparison
Arapaho
British West Indians
77.1%
IN LABOR FORCE | AGE 45-54
0.0/ 100
METRIC RATING
335th/ 347
METRIC RANK
81.2%
IN LABOR FORCE | AGE 45-54
0.0/ 100
METRIC RATING
274th/ 347
METRIC RANK
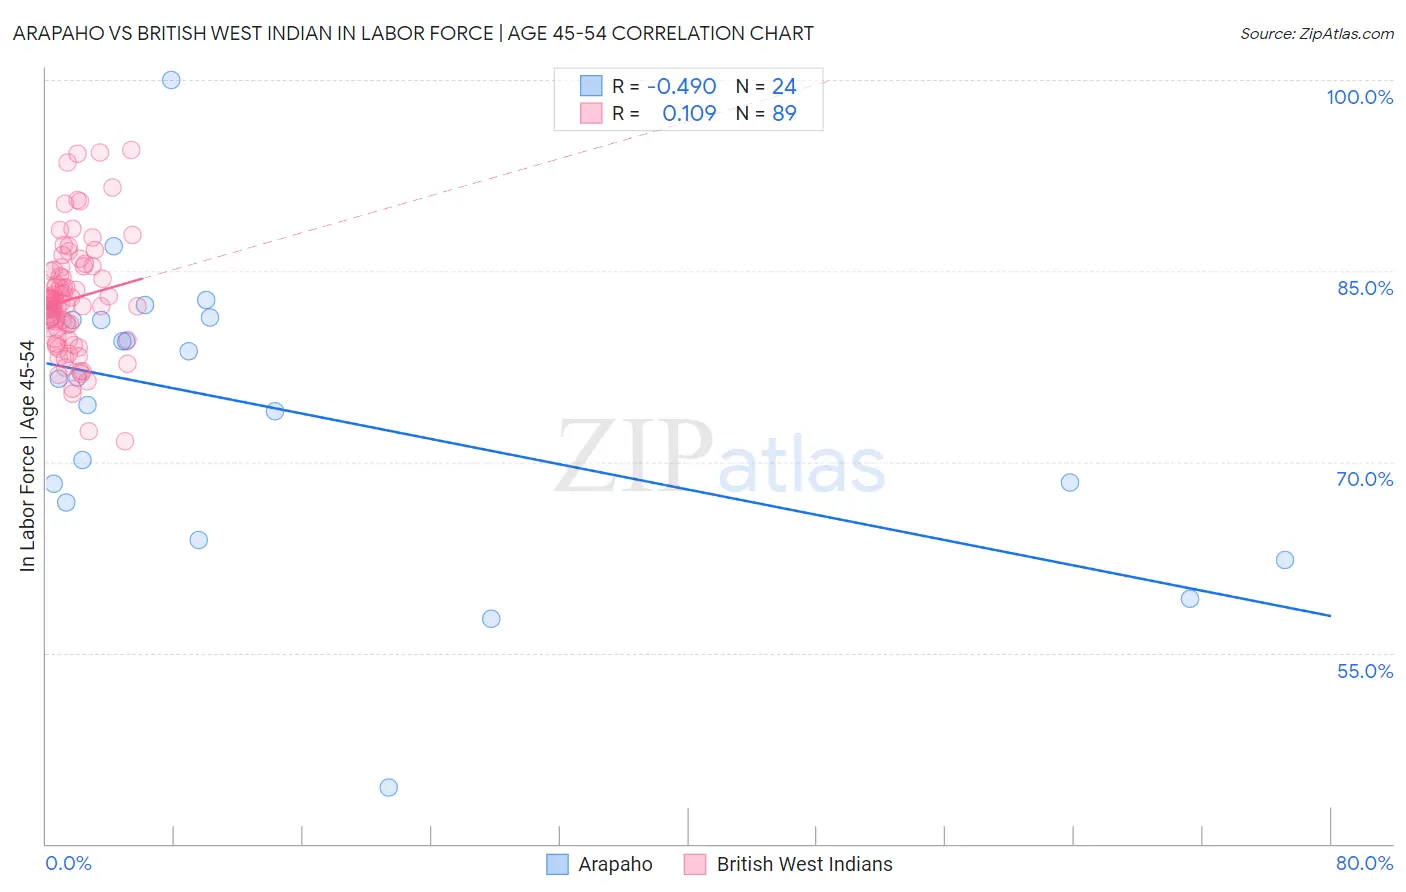
Arapaho vs British West Indian In Labor Force | Age 45-54 Correlation Chart
The statistical analysis conducted on geographies consisting of 29,770,856 people shows a moderate negative correlation between the proportion of Arapaho and labor force participation rate among population between the ages 45 and 54 in the United States with a correlation coefficient (R) of -0.490 and weighted average of 77.1%. Similarly, the statistical analysis conducted on geographies consisting of 152,595,623 people shows a poor positive correlation between the proportion of British West Indians and labor force participation rate among population between the ages 45 and 54 in the United States with a correlation coefficient (R) of 0.109 and weighted average of 81.2%, a difference of 5.4%.
In Labor Force | Age 45-54 Correlation Summary
| Measurement | Arapaho | British West Indian |
| Minimum | 44.4% | 71.6% |
| Maximum | 100.0% | 94.5% |
| Range | 55.6% | 22.9% |
| Mean | 74.1% | 82.8% |
| Median | 76.6% | 82.5% |
| Interquartile 25% (IQ1) | 67.6% | 79.7% |
| Interquartile 75% (IQ3) | 81.2% | 85.2% |
| Interquartile Range (IQR) | 13.7% | 5.5% |
| Standard Deviation (Sample) | 11.5% | 4.5% |
| Standard Deviation (Population) | 11.2% | 4.5% |
Similar Demographics by In Labor Force | Age 45-54
Demographics Similar to Arapaho by In Labor Force | Age 45-54
In terms of in labor force | age 45-54, the demographic groups most similar to Arapaho are Native/Alaskan (77.1%, a difference of 0.070%), Apache (77.1%, a difference of 0.070%), Menominee (77.4%, a difference of 0.43%), Tsimshian (77.4%, a difference of 0.46%), and Paiute (76.7%, a difference of 0.54%).
| Demographics | Rating | Rank | In Labor Force | Age 45-54 |
| Sioux | 0.0 /100 | #328 | Tragic 78.0% |
| Creek | 0.0 /100 | #329 | Tragic 77.7% |
| Cheyenne | 0.0 /100 | #330 | Tragic 77.6% |
| Tsimshian | 0.0 /100 | #331 | Tragic 77.4% |
| Menominee | 0.0 /100 | #332 | Tragic 77.4% |
| Natives/Alaskans | 0.0 /100 | #333 | Tragic 77.1% |
| Apache | 0.0 /100 | #334 | Tragic 77.1% |
| Arapaho | 0.0 /100 | #335 | Tragic 77.1% |
| Paiute | 0.0 /100 | #336 | Tragic 76.7% |
| Ute | 0.0 /100 | #337 | Tragic 76.6% |
| Yuman | 0.0 /100 | #338 | Tragic 76.3% |
| Puerto Ricans | 0.0 /100 | #339 | Tragic 75.9% |
| Lumbee | 0.0 /100 | #340 | Tragic 75.6% |
| Pueblo | 0.0 /100 | #341 | Tragic 75.5% |
| Tohono O'odham | 0.0 /100 | #342 | Tragic 75.1% |
Demographics Similar to British West Indians by In Labor Force | Age 45-54
In terms of in labor force | age 45-54, the demographic groups most similar to British West Indians are Nonimmigrants (81.2%, a difference of 0.010%), Chippewa (81.3%, a difference of 0.030%), U.S. Virgin Islander (81.2%, a difference of 0.050%), Guatemalan (81.2%, a difference of 0.070%), and Immigrants from Barbados (81.3%, a difference of 0.10%).
| Demographics | Rating | Rank | In Labor Force | Age 45-54 |
| West Indians | 0.1 /100 | #267 | Tragic 81.4% |
| Immigrants | Honduras | 0.0 /100 | #268 | Tragic 81.4% |
| Alsatians | 0.0 /100 | #269 | Tragic 81.3% |
| Bangladeshis | 0.0 /100 | #270 | Tragic 81.3% |
| Immigrants | Barbados | 0.0 /100 | #271 | Tragic 81.3% |
| Spanish | 0.0 /100 | #272 | Tragic 81.3% |
| Chippewa | 0.0 /100 | #273 | Tragic 81.3% |
| British West Indians | 0.0 /100 | #274 | Tragic 81.2% |
| Immigrants | Nonimmigrants | 0.0 /100 | #275 | Tragic 81.2% |
| U.S. Virgin Islanders | 0.0 /100 | #276 | Tragic 81.2% |
| Guatemalans | 0.0 /100 | #277 | Tragic 81.2% |
| Immigrants | Guatemala | 0.0 /100 | #278 | Tragic 81.1% |
| Immigrants | Micronesia | 0.0 /100 | #279 | Tragic 81.1% |
| Immigrants | Latin America | 0.0 /100 | #280 | Tragic 81.0% |
| Immigrants | Grenada | 0.0 /100 | #281 | Tragic 81.0% |