Immigrants from Egypt vs Immigrants from Saudi Arabia In Labor Force | Age 25-29
COMPARE
Immigrants from Egypt
Immigrants from Saudi Arabia
In Labor Force | Age 25-29
In Labor Force | Age 25-29 Comparison
Immigrants from Egypt
Immigrants from Saudi Arabia
85.2%
IN LABOR FORCE | AGE 25-29
97.7/ 100
METRIC RATING
78th/ 347
METRIC RANK
84.3%
IN LABOR FORCE | AGE 25-29
8.8/ 100
METRIC RATING
219th/ 347
METRIC RANK
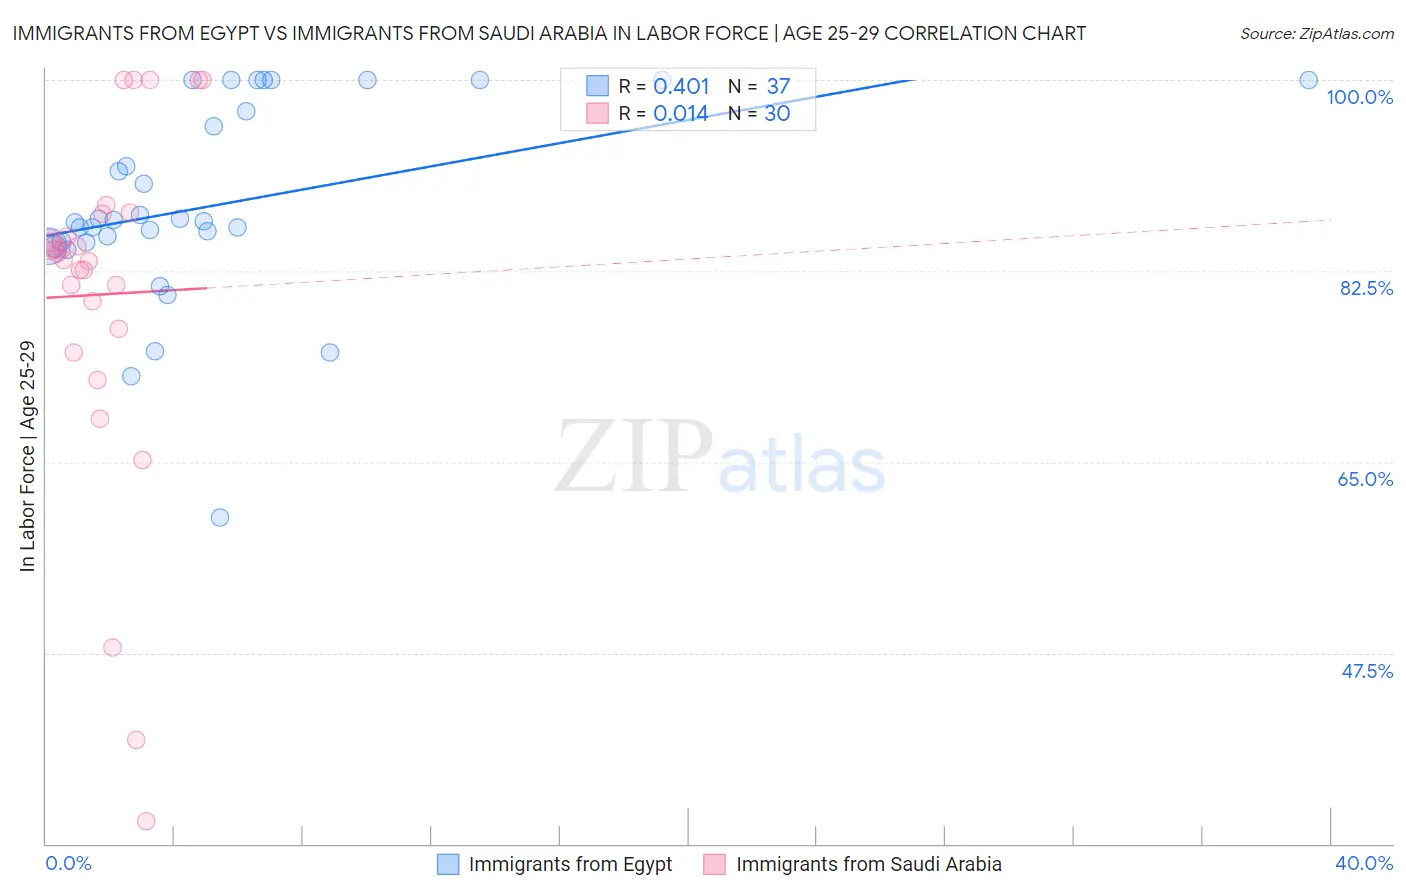
Immigrants from Egypt vs Immigrants from Saudi Arabia In Labor Force | Age 25-29 Correlation Chart
The statistical analysis conducted on geographies consisting of 245,441,194 people shows a moderate positive correlation between the proportion of Immigrants from Egypt and labor force participation rate among population between the ages 25 and 29 in the United States with a correlation coefficient (R) of 0.401 and weighted average of 85.2%. Similarly, the statistical analysis conducted on geographies consisting of 164,273,272 people shows no correlation between the proportion of Immigrants from Saudi Arabia and labor force participation rate among population between the ages 25 and 29 in the United States with a correlation coefficient (R) of 0.014 and weighted average of 84.3%, a difference of 1.1%.
In Labor Force | Age 25-29 Correlation Summary
| Measurement | Immigrants from Egypt | Immigrants from Saudi Arabia |
| Minimum | 59.9% | 32.1% |
| Maximum | 100.0% | 100.0% |
| Range | 40.1% | 67.9% |
| Mean | 88.6% | 80.3% |
| Median | 87.1% | 83.8% |
| Interquartile 25% (IQ1) | 85.0% | 77.2% |
| Interquartile 75% (IQ3) | 98.6% | 87.7% |
| Interquartile Range (IQR) | 13.6% | 10.5% |
| Standard Deviation (Sample) | 9.1% | 16.4% |
| Standard Deviation (Population) | 9.0% | 16.1% |
Similar Demographics by In Labor Force | Age 25-29
Demographics Similar to Immigrants from Egypt by In Labor Force | Age 25-29
In terms of in labor force | age 25-29, the demographic groups most similar to Immigrants from Egypt are Immigrants from Northern Africa (85.2%, a difference of 0.010%), Immigrants from Zimbabwe (85.2%, a difference of 0.010%), Immigrants from South Central Asia (85.2%, a difference of 0.020%), German (85.3%, a difference of 0.030%), and Immigrants from Northern Europe (85.2%, a difference of 0.030%).
| Demographics | Rating | Rank | In Labor Force | Age 25-29 |
| Kenyans | 99.0 /100 | #71 | Exceptional 85.4% |
| Immigrants | Australia | 98.9 /100 | #72 | Exceptional 85.3% |
| Russians | 98.8 /100 | #73 | Exceptional 85.3% |
| Soviet Union | 98.5 /100 | #74 | Exceptional 85.3% |
| Brazilians | 98.3 /100 | #75 | Exceptional 85.3% |
| Germans | 98.1 /100 | #76 | Exceptional 85.3% |
| Immigrants | South Central Asia | 97.9 /100 | #77 | Exceptional 85.2% |
| Immigrants | Egypt | 97.7 /100 | #78 | Exceptional 85.2% |
| Immigrants | Northern Africa | 97.6 /100 | #79 | Exceptional 85.2% |
| Immigrants | Zimbabwe | 97.6 /100 | #80 | Exceptional 85.2% |
| Immigrants | Northern Europe | 97.2 /100 | #81 | Exceptional 85.2% |
| Okinawans | 97.0 /100 | #82 | Exceptional 85.2% |
| Immigrants | Europe | 96.8 /100 | #83 | Exceptional 85.2% |
| Immigrants | Eastern Europe | 96.8 /100 | #84 | Exceptional 85.2% |
| Immigrants | Africa | 96.7 /100 | #85 | Exceptional 85.2% |
Demographics Similar to Immigrants from Saudi Arabia by In Labor Force | Age 25-29
In terms of in labor force | age 25-29, the demographic groups most similar to Immigrants from Saudi Arabia are Immigrants from Nigeria (84.3%, a difference of 0.0%), Israeli (84.3%, a difference of 0.010%), Immigrants from Ecuador (84.3%, a difference of 0.010%), Immigrants from Syria (84.3%, a difference of 0.040%), and Nigerian (84.3%, a difference of 0.040%).
| Demographics | Rating | Rank | In Labor Force | Age 25-29 |
| Sub-Saharan Africans | 11.7 /100 | #212 | Poor 84.3% |
| Japanese | 11.4 /100 | #213 | Poor 84.3% |
| Lebanese | 11.1 /100 | #214 | Poor 84.3% |
| Immigrants | Syria | 10.7 /100 | #215 | Poor 84.3% |
| Israelis | 9.3 /100 | #216 | Tragic 84.3% |
| Immigrants | Ecuador | 9.3 /100 | #217 | Tragic 84.3% |
| Immigrants | Nigeria | 9.0 /100 | #218 | Tragic 84.3% |
| Immigrants | Saudi Arabia | 8.8 /100 | #219 | Tragic 84.3% |
| Nigerians | 7.2 /100 | #220 | Tragic 84.3% |
| Arabs | 6.8 /100 | #221 | Tragic 84.2% |
| Jordanians | 6.7 /100 | #222 | Tragic 84.2% |
| Scotch-Irish | 6.5 /100 | #223 | Tragic 84.2% |
| Immigrants | West Indies | 6.0 /100 | #224 | Tragic 84.2% |
| Koreans | 5.9 /100 | #225 | Tragic 84.2% |
| Immigrants | Congo | 5.8 /100 | #226 | Tragic 84.2% |