Immigrants from Egypt vs Mongolian In Labor Force | Age 25-29
COMPARE
Immigrants from Egypt
Mongolian
In Labor Force | Age 25-29
In Labor Force | Age 25-29 Comparison
Immigrants from Egypt
Mongolians
85.2%
IN LABOR FORCE | AGE 25-29
97.7/ 100
METRIC RATING
78th/ 347
METRIC RANK
85.1%
IN LABOR FORCE | AGE 25-29
94.1/ 100
METRIC RATING
98th/ 347
METRIC RANK
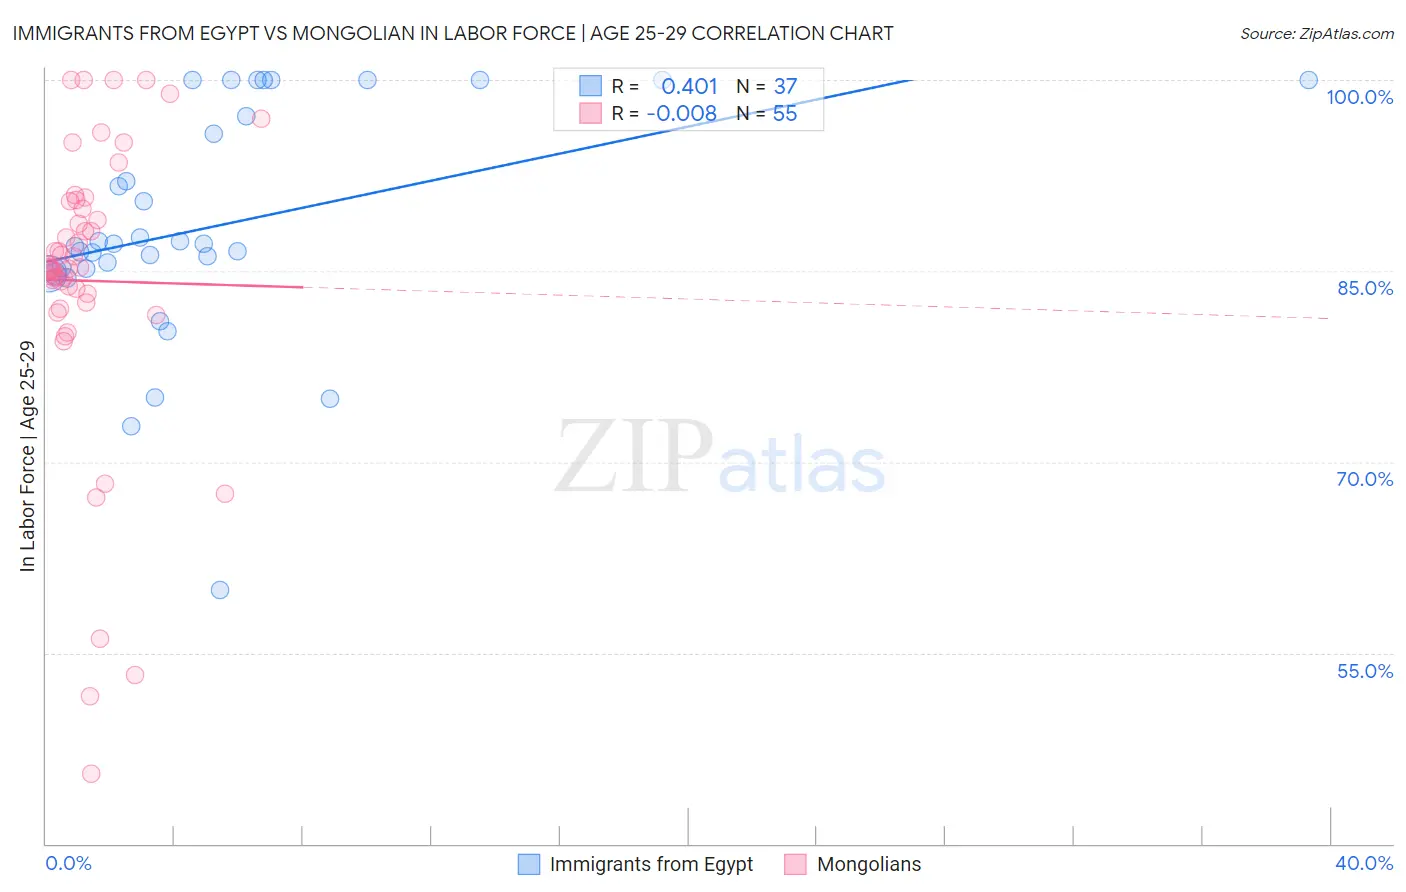
Immigrants from Egypt vs Mongolian In Labor Force | Age 25-29 Correlation Chart
The statistical analysis conducted on geographies consisting of 245,441,194 people shows a moderate positive correlation between the proportion of Immigrants from Egypt and labor force participation rate among population between the ages 25 and 29 in the United States with a correlation coefficient (R) of 0.401 and weighted average of 85.2%. Similarly, the statistical analysis conducted on geographies consisting of 140,349,475 people shows no correlation between the proportion of Mongolians and labor force participation rate among population between the ages 25 and 29 in the United States with a correlation coefficient (R) of -0.008 and weighted average of 85.1%, a difference of 0.18%.
In Labor Force | Age 25-29 Correlation Summary
| Measurement | Immigrants from Egypt | Mongolian |
| Minimum | 59.9% | 45.5% |
| Maximum | 100.0% | 100.0% |
| Range | 40.1% | 54.5% |
| Mean | 88.6% | 84.2% |
| Median | 87.1% | 85.2% |
| Interquartile 25% (IQ1) | 85.0% | 82.5% |
| Interquartile 75% (IQ3) | 98.6% | 90.5% |
| Interquartile Range (IQR) | 13.6% | 8.0% |
| Standard Deviation (Sample) | 9.1% | 11.7% |
| Standard Deviation (Population) | 9.0% | 11.6% |
Demographics Similar to Immigrants from Egypt and Mongolians by In Labor Force | Age 25-29
In terms of in labor force | age 25-29, the demographic groups most similar to Immigrants from Egypt are Immigrants from Northern Africa (85.2%, a difference of 0.010%), Immigrants from Zimbabwe (85.2%, a difference of 0.010%), Immigrants from Northern Europe (85.2%, a difference of 0.030%), Okinawan (85.2%, a difference of 0.050%), and Immigrants from Europe (85.2%, a difference of 0.060%). Similarly, the demographic groups most similar to Mongolians are Immigrants from Sudan (85.1%, a difference of 0.010%), Immigrants from Netherlands (85.1%, a difference of 0.020%), Immigrants from Romania (85.1%, a difference of 0.020%), Immigrants from Korea (85.1%, a difference of 0.030%), and Austrian (85.1%, a difference of 0.040%).
| Demographics | Rating | Rank | In Labor Force | Age 25-29 |
| Immigrants | Egypt | 97.7 /100 | #78 | Exceptional 85.2% |
| Immigrants | Northern Africa | 97.6 /100 | #79 | Exceptional 85.2% |
| Immigrants | Zimbabwe | 97.6 /100 | #80 | Exceptional 85.2% |
| Immigrants | Northern Europe | 97.2 /100 | #81 | Exceptional 85.2% |
| Okinawans | 97.0 /100 | #82 | Exceptional 85.2% |
| Immigrants | Europe | 96.8 /100 | #83 | Exceptional 85.2% |
| Immigrants | Eastern Europe | 96.8 /100 | #84 | Exceptional 85.2% |
| Immigrants | Africa | 96.7 /100 | #85 | Exceptional 85.2% |
| Ukrainians | 96.7 /100 | #86 | Exceptional 85.2% |
| French Canadians | 96.5 /100 | #87 | Exceptional 85.2% |
| Immigrants | Croatia | 96.4 /100 | #88 | Exceptional 85.2% |
| Immigrants | France | 96.3 /100 | #89 | Exceptional 85.2% |
| Burmese | 95.9 /100 | #90 | Exceptional 85.1% |
| Immigrants | Moldova | 95.8 /100 | #91 | Exceptional 85.1% |
| Immigrants | Costa Rica | 95.5 /100 | #92 | Exceptional 85.1% |
| Austrians | 95.3 /100 | #93 | Exceptional 85.1% |
| Immigrants | Korea | 94.8 /100 | #94 | Exceptional 85.1% |
| Immigrants | Netherlands | 94.6 /100 | #95 | Exceptional 85.1% |
| Immigrants | Romania | 94.6 /100 | #96 | Exceptional 85.1% |
| Immigrants | Sudan | 94.3 /100 | #97 | Exceptional 85.1% |
| Mongolians | 94.1 /100 | #98 | Exceptional 85.1% |