Immigrants from Egypt vs Hungarian In Labor Force | Age 45-54
COMPARE
Immigrants from Egypt
Hungarian
In Labor Force | Age 45-54
In Labor Force | Age 45-54 Comparison
Immigrants from Egypt
Hungarians
83.4%
IN LABOR FORCE | AGE 45-54
96.6/ 100
METRIC RATING
78th/ 347
METRIC RANK
82.7%
IN LABOR FORCE | AGE 45-54
38.0/ 100
METRIC RATING
180th/ 347
METRIC RANK
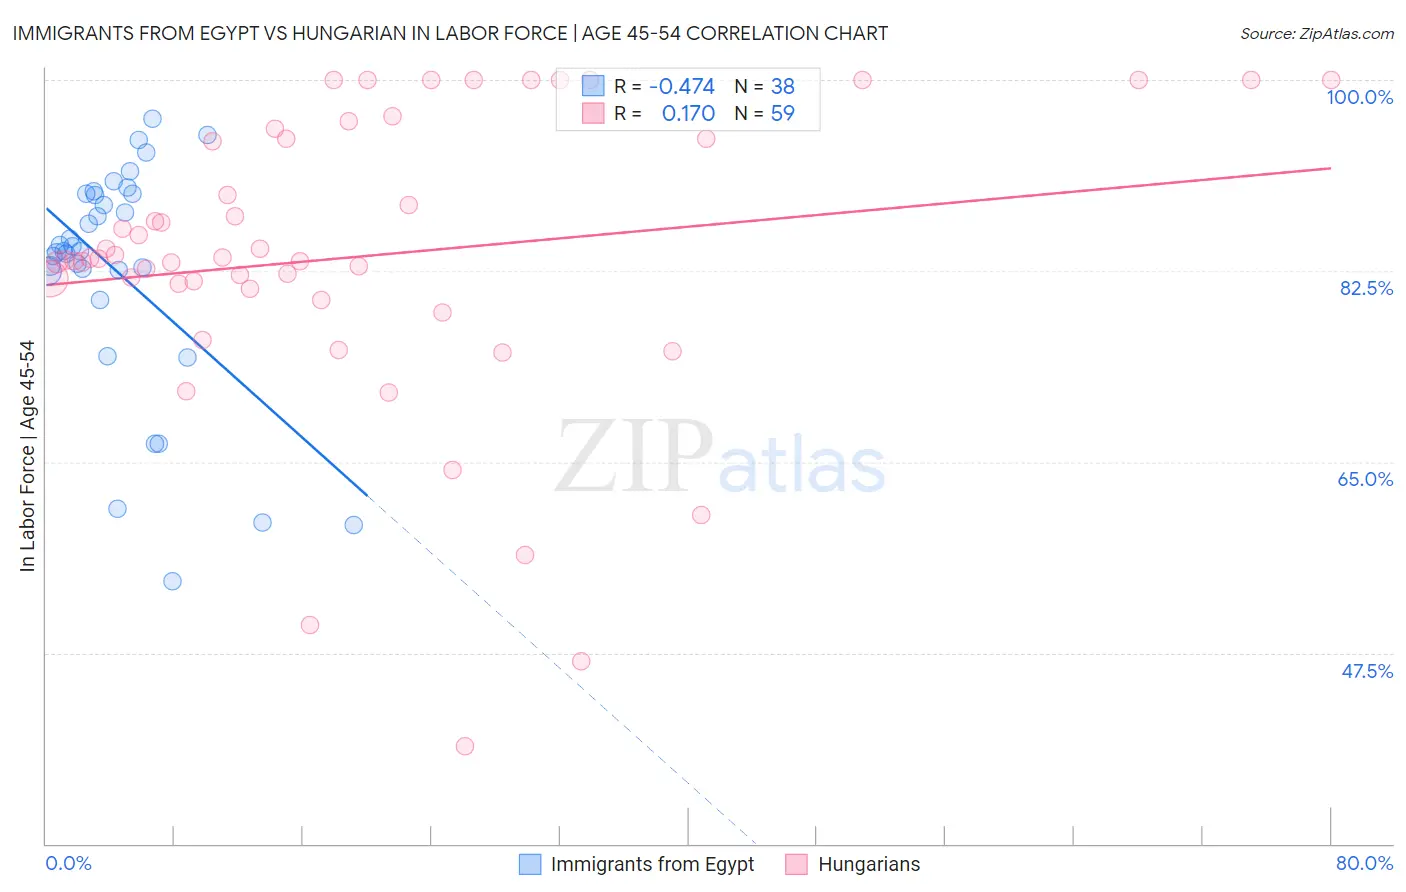
Immigrants from Egypt vs Hungarian In Labor Force | Age 45-54 Correlation Chart
The statistical analysis conducted on geographies consisting of 245,402,368 people shows a moderate negative correlation between the proportion of Immigrants from Egypt and labor force participation rate among population between the ages 45 and 54 in the United States with a correlation coefficient (R) of -0.474 and weighted average of 83.4%. Similarly, the statistical analysis conducted on geographies consisting of 485,857,065 people shows a poor positive correlation between the proportion of Hungarians and labor force participation rate among population between the ages 45 and 54 in the United States with a correlation coefficient (R) of 0.170 and weighted average of 82.7%, a difference of 0.85%.
In Labor Force | Age 45-54 Correlation Summary
| Measurement | Immigrants from Egypt | Hungarian |
| Minimum | 54.1% | 38.9% |
| Maximum | 96.5% | 100.0% |
| Range | 42.4% | 61.1% |
| Mean | 82.3% | 83.8% |
| Median | 84.3% | 83.6% |
| Interquartile 25% (IQ1) | 82.4% | 80.9% |
| Interquartile 75% (IQ3) | 89.5% | 94.6% |
| Interquartile Range (IQR) | 7.1% | 13.7% |
| Standard Deviation (Sample) | 10.6% | 13.6% |
| Standard Deviation (Population) | 10.5% | 13.5% |
Similar Demographics by In Labor Force | Age 45-54
Demographics Similar to Immigrants from Egypt by In Labor Force | Age 45-54
In terms of in labor force | age 45-54, the demographic groups most similar to Immigrants from Egypt are Russian (83.4%, a difference of 0.010%), Cuban (83.4%, a difference of 0.010%), Belgian (83.4%, a difference of 0.010%), Immigrants from Croatia (83.4%, a difference of 0.010%), and Jordanian (83.4%, a difference of 0.010%).
| Demographics | Rating | Rank | In Labor Force | Age 45-54 |
| Colombians | 97.3 /100 | #71 | Exceptional 83.4% |
| Serbians | 97.2 /100 | #72 | Exceptional 83.4% |
| Immigrants | Czechoslovakia | 97.1 /100 | #73 | Exceptional 83.4% |
| Immigrants | Somalia | 96.9 /100 | #74 | Exceptional 83.4% |
| Estonians | 96.9 /100 | #75 | Exceptional 83.4% |
| Russians | 96.8 /100 | #76 | Exceptional 83.4% |
| Cubans | 96.7 /100 | #77 | Exceptional 83.4% |
| Immigrants | Egypt | 96.6 /100 | #78 | Exceptional 83.4% |
| Belgians | 96.5 /100 | #79 | Exceptional 83.4% |
| Immigrants | Croatia | 96.5 /100 | #80 | Exceptional 83.4% |
| Jordanians | 96.4 /100 | #81 | Exceptional 83.4% |
| Immigrants | Eastern Asia | 96.3 /100 | #82 | Exceptional 83.4% |
| Immigrants | Zimbabwe | 96.3 /100 | #83 | Exceptional 83.4% |
| Immigrants | Bosnia and Herzegovina | 96.0 /100 | #84 | Exceptional 83.3% |
| Greeks | 95.9 /100 | #85 | Exceptional 83.3% |
Demographics Similar to Hungarians by In Labor Force | Age 45-54
In terms of in labor force | age 45-54, the demographic groups most similar to Hungarians are Israeli (82.7%, a difference of 0.0%), Immigrants from Switzerland (82.7%, a difference of 0.010%), Immigrants from Hungary (82.7%, a difference of 0.010%), Nigerian (82.7%, a difference of 0.020%), and New Zealander (82.6%, a difference of 0.050%).
| Demographics | Rating | Rank | In Labor Force | Age 45-54 |
| Nicaraguans | 50.3 /100 | #173 | Average 82.8% |
| Costa Ricans | 50.0 /100 | #174 | Average 82.8% |
| Immigrants | Liberia | 47.9 /100 | #175 | Average 82.7% |
| Northern Europeans | 46.9 /100 | #176 | Average 82.7% |
| Immigrants | Nicaragua | 44.6 /100 | #177 | Average 82.7% |
| Nigerians | 40.5 /100 | #178 | Average 82.7% |
| Immigrants | Switzerland | 39.4 /100 | #179 | Fair 82.7% |
| Hungarians | 38.0 /100 | #180 | Fair 82.7% |
| Israelis | 37.7 /100 | #181 | Fair 82.7% |
| Immigrants | Hungary | 37.1 /100 | #182 | Fair 82.7% |
| New Zealanders | 32.7 /100 | #183 | Fair 82.6% |
| Europeans | 32.6 /100 | #184 | Fair 82.6% |
| Immigrants | England | 32.2 /100 | #185 | Fair 82.6% |
| Irish | 29.2 /100 | #186 | Fair 82.6% |
| Immigrants | Costa Rica | 28.3 /100 | #187 | Fair 82.6% |