Immigrants from Egypt vs Immigrants from Congo In Labor Force | Age 45-54
COMPARE
Immigrants from Egypt
Immigrants from Congo
In Labor Force | Age 45-54
In Labor Force | Age 45-54 Comparison
Immigrants from Egypt
Immigrants from Congo
83.4%
IN LABOR FORCE | AGE 45-54
96.6/ 100
METRIC RATING
78th/ 347
METRIC RANK
81.6%
IN LABOR FORCE | AGE 45-54
0.1/ 100
METRIC RATING
257th/ 347
METRIC RANK
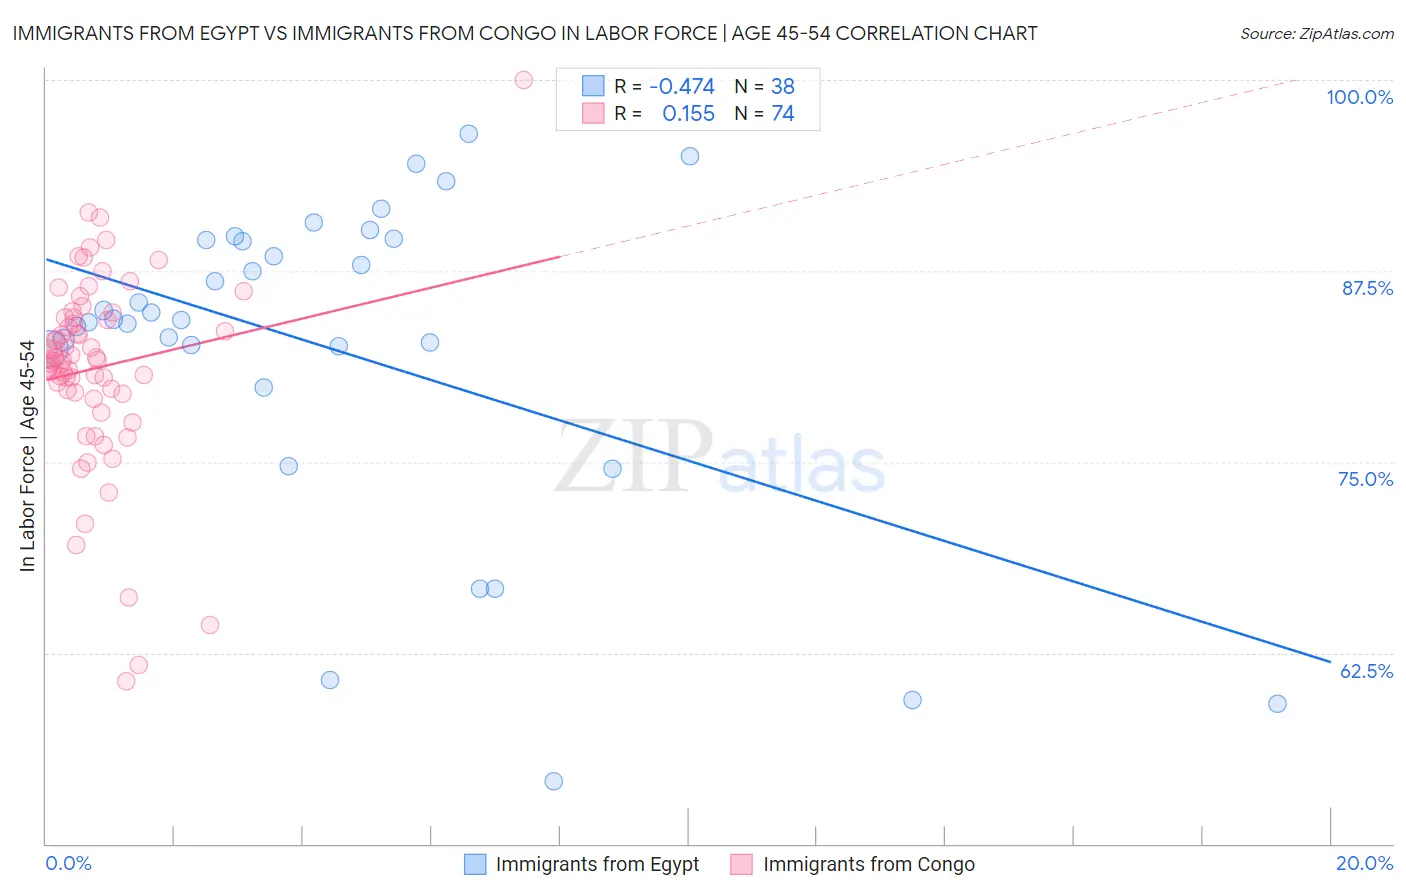
Immigrants from Egypt vs Immigrants from Congo In Labor Force | Age 45-54 Correlation Chart
The statistical analysis conducted on geographies consisting of 245,402,368 people shows a moderate negative correlation between the proportion of Immigrants from Egypt and labor force participation rate among population between the ages 45 and 54 in the United States with a correlation coefficient (R) of -0.474 and weighted average of 83.4%. Similarly, the statistical analysis conducted on geographies consisting of 92,030,228 people shows a poor positive correlation between the proportion of Immigrants from Congo and labor force participation rate among population between the ages 45 and 54 in the United States with a correlation coefficient (R) of 0.155 and weighted average of 81.6%, a difference of 2.2%.
In Labor Force | Age 45-54 Correlation Summary
| Measurement | Immigrants from Egypt | Immigrants from Congo |
| Minimum | 54.1% | 60.6% |
| Maximum | 96.5% | 100.0% |
| Range | 42.4% | 39.4% |
| Mean | 82.3% | 81.1% |
| Median | 84.3% | 81.7% |
| Interquartile 25% (IQ1) | 82.4% | 79.5% |
| Interquartile 75% (IQ3) | 89.5% | 84.5% |
| Interquartile Range (IQR) | 7.1% | 5.0% |
| Standard Deviation (Sample) | 10.6% | 6.4% |
| Standard Deviation (Population) | 10.5% | 6.4% |
Similar Demographics by In Labor Force | Age 45-54
Demographics Similar to Immigrants from Egypt by In Labor Force | Age 45-54
In terms of in labor force | age 45-54, the demographic groups most similar to Immigrants from Egypt are Russian (83.4%, a difference of 0.010%), Cuban (83.4%, a difference of 0.010%), Belgian (83.4%, a difference of 0.010%), Immigrants from Croatia (83.4%, a difference of 0.010%), and Jordanian (83.4%, a difference of 0.010%).
| Demographics | Rating | Rank | In Labor Force | Age 45-54 |
| Colombians | 97.3 /100 | #71 | Exceptional 83.4% |
| Serbians | 97.2 /100 | #72 | Exceptional 83.4% |
| Immigrants | Czechoslovakia | 97.1 /100 | #73 | Exceptional 83.4% |
| Immigrants | Somalia | 96.9 /100 | #74 | Exceptional 83.4% |
| Estonians | 96.9 /100 | #75 | Exceptional 83.4% |
| Russians | 96.8 /100 | #76 | Exceptional 83.4% |
| Cubans | 96.7 /100 | #77 | Exceptional 83.4% |
| Immigrants | Egypt | 96.6 /100 | #78 | Exceptional 83.4% |
| Belgians | 96.5 /100 | #79 | Exceptional 83.4% |
| Immigrants | Croatia | 96.5 /100 | #80 | Exceptional 83.4% |
| Jordanians | 96.4 /100 | #81 | Exceptional 83.4% |
| Immigrants | Eastern Asia | 96.3 /100 | #82 | Exceptional 83.4% |
| Immigrants | Zimbabwe | 96.3 /100 | #83 | Exceptional 83.4% |
| Immigrants | Bosnia and Herzegovina | 96.0 /100 | #84 | Exceptional 83.3% |
| Greeks | 95.9 /100 | #85 | Exceptional 83.3% |
Demographics Similar to Immigrants from Congo by In Labor Force | Age 45-54
In terms of in labor force | age 45-54, the demographic groups most similar to Immigrants from Congo are Immigrants from Fiji (81.5%, a difference of 0.010%), Barbadian (81.6%, a difference of 0.020%), Guyanese (81.5%, a difference of 0.020%), Scotch-Irish (81.6%, a difference of 0.050%), and Spaniard (81.5%, a difference of 0.050%).
| Demographics | Rating | Rank | In Labor Force | Age 45-54 |
| Immigrants | Armenia | 0.2 /100 | #250 | Tragic 81.7% |
| Guamanians/Chamorros | 0.2 /100 | #251 | Tragic 81.6% |
| Pennsylvania Germans | 0.2 /100 | #252 | Tragic 81.6% |
| Japanese | 0.2 /100 | #253 | Tragic 81.6% |
| Immigrants | Laos | 0.2 /100 | #254 | Tragic 81.6% |
| Scotch-Irish | 0.2 /100 | #255 | Tragic 81.6% |
| Barbadians | 0.1 /100 | #256 | Tragic 81.6% |
| Immigrants | Congo | 0.1 /100 | #257 | Tragic 81.6% |
| Immigrants | Fiji | 0.1 /100 | #258 | Tragic 81.5% |
| Guyanese | 0.1 /100 | #259 | Tragic 81.5% |
| Spaniards | 0.1 /100 | #260 | Tragic 81.5% |
| Hawaiians | 0.1 /100 | #261 | Tragic 81.5% |
| Immigrants | Guyana | 0.1 /100 | #262 | Tragic 81.5% |
| Indonesians | 0.1 /100 | #263 | Tragic 81.5% |
| Immigrants | West Indies | 0.1 /100 | #264 | Tragic 81.5% |